





What drives business performance, measured.
PIMS® links the market position, operations, and cost and capital structure of more than 4,300 business units to their financial results. The data comes from confidential management accounts, collected between 1967 and today and never published.
Used to set targets, value investments and test how AI models reason about business performance.

Who can work with PIMS data
AI labs and evaluation providers
Test judgement against real outcomes
Measure how well models judge strategy and performance, using thousands of business records no model has seen, each with a reported result to score against.
How AI evaluation works →Company leaders and strategy teams
Targets grounded in comparable businesses
See what profitability your business can sustain given its position, and what stronger performers in comparable positions do differently.
See Strategic Benchmarking →Strategy and consulting firms
Evidence from comparable businesses
Set targets and test recommendations against the outcomes of structurally comparable businesses, not case studies.
See the models →Investors and private equity
Profit potential beyond historical financials
Compare a company's actual return with its PAR. Below PAR can indicate unrealised potential; above PAR, a likely decline towards it. Apply it in due diligence or across a portfolio.
See the models →Academic researchers
A documented panel with a published record
Business-unit panel data with maintained variable definitions, used in research published in Harvard Business Review, Strategic Management Journal and Journal of Marketing.
See the data specification →Recorded where decisions are made, and followed over time.
Most business data comes from surveys, public filings or market snapshots. PIMS® records the internal metrics of individual business units, taken from their management accounts, and follows each unit for several years.
At business-unit level
Each strategic business unit (SBU) has its own recorded market, competitors and customers. Group accounts blend several businesses and hide the choices that drive each one. PIMS records market share, relative quality, pricing, innovation, cost and capital where they are decided.
Followed over time
Each business unit is observed for at least three years, five on average. Analysts can compare the same business before and after a change: what it changed, and how its profitability and growth moved afterwards.
Comparable across industries and decades
Every variable has a maintained definition, formula and collection protocol. A business measured in 1985 can be compared with one measured in 2025, and an industrial supplier with a consumer brand.
Not available anywhere else
The data comes from confidential management accounts, collected with each contributing business at the time. It has never been published, is not part of any AI training dataset to date, and cannot be reconstructed from public sources. No other source we know of records relative market share, relative quality and financial results for the same business units over time, across industries.
Test AI against what actually happened.
AI models are increasingly asked to judge strategy, forecast performance and advise on investment. Execution tasks can be graded against an expert's answer. Judgement is harder: a recommendation is hard to score when nobody knows the right answer. PIMS® supplies tasks where the answer is what a real business went on to report.
Judgement with an answer key
Given a business unit's structural profile, estimate its return on sales. For a unit tracked over several years, estimate its return on sales three years later. Answers are numbers, scored by their distance from the reported figure, with no LLM judge.
Thousands of items, hard to saturate
Every observation pairs a profile with reported results, so tasks run into the thousands. The answer can be estimated from the inputs but not derived from them, so average error keeps separating models as they improve.
Unseen by any model
The records have never been published and are not part of any AI training dataset to date, so no model can have seen the answers. Items held back for evaluation stay unseen.
Real businesses, not fictional worlds
Agent environments can be built around an anonymised PIMS® business, with later years held back. Its figures fit together the way a real business's do, and the outcome is what actually happened.
Difficulty you can measure
Fit a statistical model to the panel, or use PAR, as a reference. That separates two questions: how predictable an outcome is from the data, and how much of it a language model gets by reasoning.
Illustrative task
A business unit holds a smaller share than its leading competitors, its customers rate its quality below theirs, and it invests heavily relative to sales in a slow-growing market. What return on sales does it report three years later?
Scored by distance from the reported figure. Thousands of such cases can be drawn from the data.
Anonymised extracts and a data dictionary are available under NDA, or we can build and run task sets in our own environment.
See access options →
What's in the data
477 variables per business unit, in five groups.
Five variable groups
At a glance
Coverage notes
- Coverage spans every major industry group across North America, Europe and Asia.
- Because PIMS® began at General Electric, North American, manufacturing-intensive businesses from before 2000 are the most heavily represented.
- Business units joined at different times and were each tracked for 3 to 12 years, so no single unit spans the whole period from 1967 to date.
- Pre-revenue and very early-stage businesses are excluded. Their market share, cost structure and margins are still taking shape, and many run at a loss on purpose to win market share, so their results reflect start-up choices more than competitive position. Including them would blur the link between position and performance that the data is built to measure.
Findings that have held across industries and decades
PIMS research has been published since the 1970s. Three of its best-known findings, first set out in 1987, still hold in the current data:
Relative quality pays
Businesses whose customers rate their offering above competitors' earn higher returns, on average, than those rated below.
Relative market share matters
Market share relative to the largest competitors is strongly associated with profitability.
Heavy investment depresses returns
Businesses with high investment relative to sales tend to earn lower returns on investment, unless productivity and market position offset it.
First published in Buzzell & Gale (1987), The PIMS Principles: Linking Strategy to Performance, Free Press. More findings: Nine Basic Findings on Business Strategy.
Models built on the data
Profit Potential Analysis (PAR®)
Estimates the return on sales a business can sustain, from 15 structural factors covering competitive position, market environment, and cost and capital structure. Because they are leading indicators, not accounting components of profit, PAR is a prediction rather than a reconstruction.
VARIATION IN LONG-TERM PROFITABILITY, APPROXIMATE SHARES
* PAR predicts profitability from leading, structural factors, so 100% is not achievable. Explaining all of it would mean rebuilding profit from its own accounting parts (revenue minus costs): arithmetic after the fact, which lags rather than predicts.
Strategic Peer Analysis
Takes the business being analysed and finds the most structurally similar businesses in the database: its strategic peers, or look-alikes. It then splits them into winners and losers to show which differences account for the gap.
Cause-Effect Model
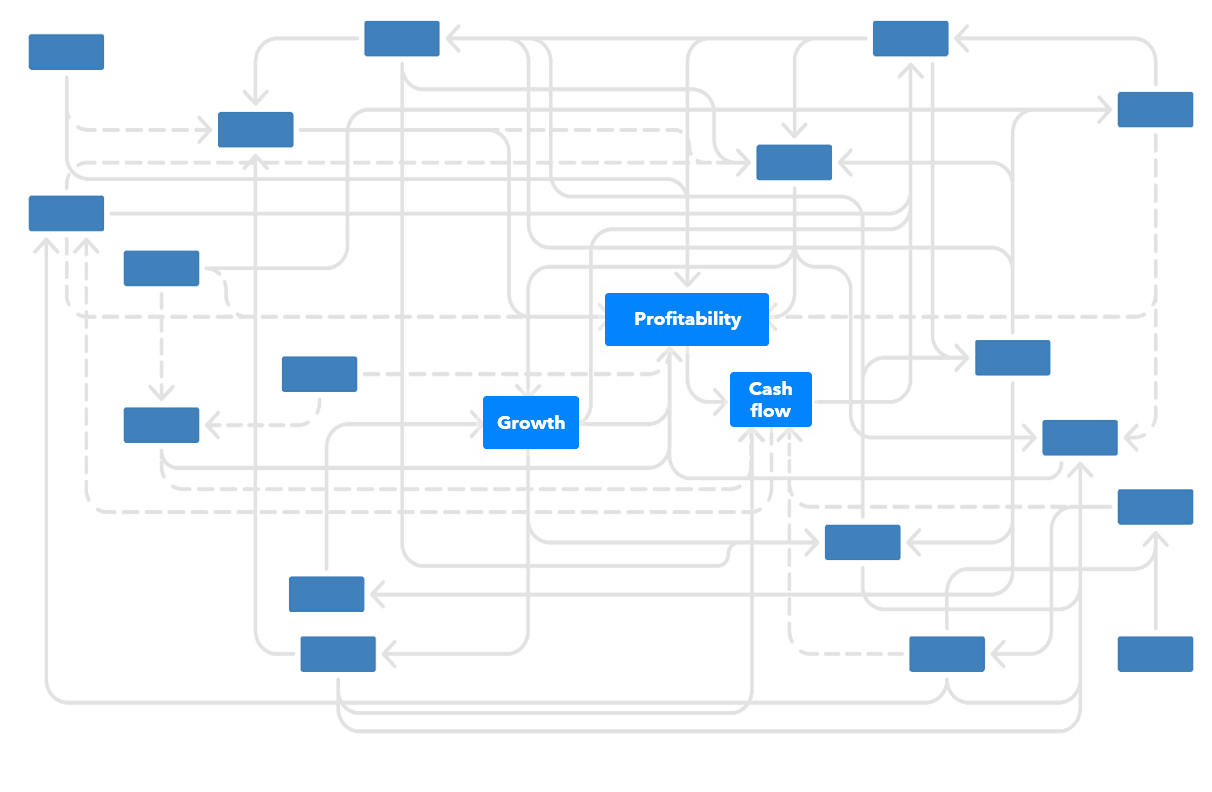
Maps the direction, size and order of the links between strategic variables and outcomes: which levers move profitability, growth and cash flow, directly or through other variables.
Ways to work with the data
Every arrangement is shaped around how the data will be used, and agreed under licence. Typical arrangements include:
Custom analysis. We run the analysis your question needs and deliver the results; record-level data stays with us.
Model evaluation. We run your model against held-out PIMS cases and report the results; the data stays with us.
Research licence. Anonymised extracts for defined research questions, under NDA.
Benchmarks and model outputs. Aggregated benchmarks and model results for your own analysis or products.
Partnership. Joint research or products built on the data.
Secure workspace. Work with the data yourself in an environment we control.
Tell us what you want to do with the data, and we will set out the options.
Six decades of research

PIMS® (Profit Impact of Market Strategy) began at General Electric in the 1960s as a study of what drives business success. In the 1970s it became a multi-company programme, led by Harvard Business School among others, and was later run by the Strategic Planning Institute in Cambridge, Massachusetts. Publicly known participants include Siemens, Nestlé and P&G.
Its findings have been published in Harvard Business Review, Strategic Management Journal, Journal of Marketing and Long Range Planning, and summarised in The PIMS Principles (Buzzell & Gale, 1987).
pims.ai | malik maintains and extends the database. Headquartered in London, with offices in St Gallen and Beijing, it applies statistics and machine learning to the data, and combines PIMS benchmarking with Malik Management® for strategy and organisational transformation.
PIMS – the broadest and best management database in the world – is the only source of strategic principles based on fact rather than opinion.
Check whether PIMS fits your question.
Ask for a sample extract or the data dictionary under NDA. We will take you through coverage, variables and access options.