

Talk to an expert
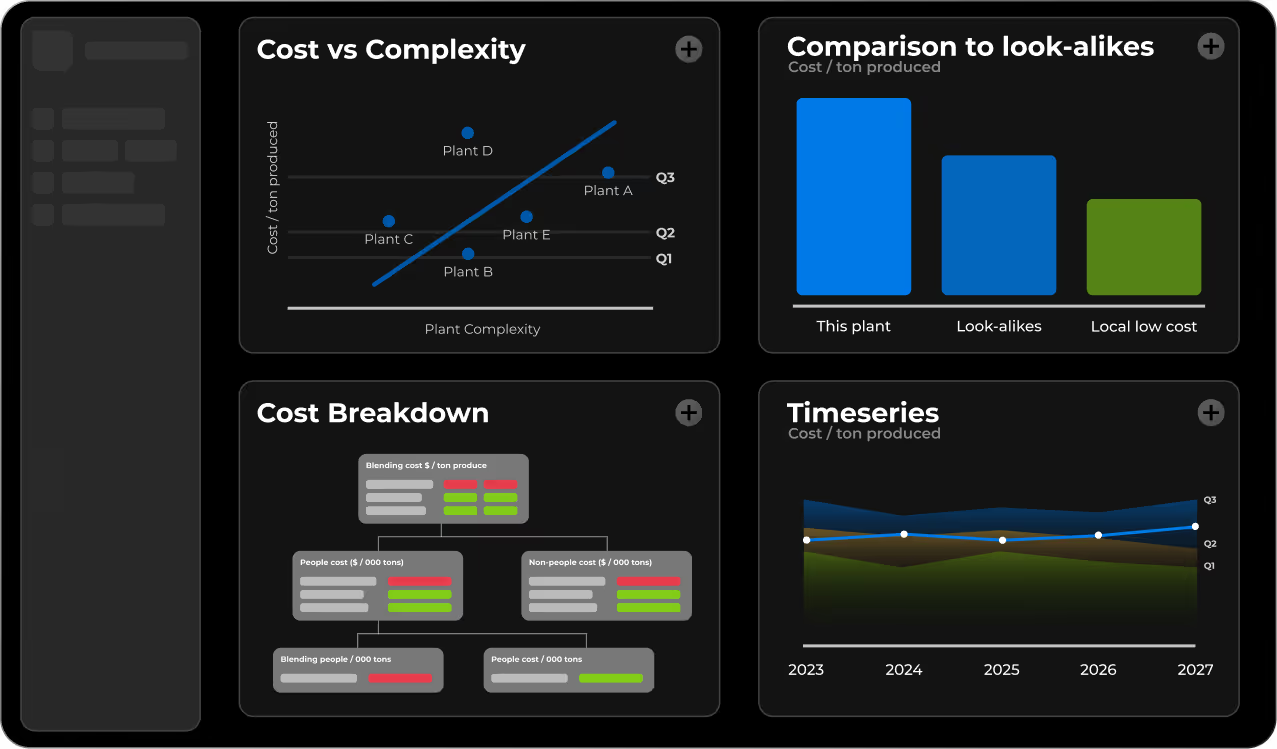


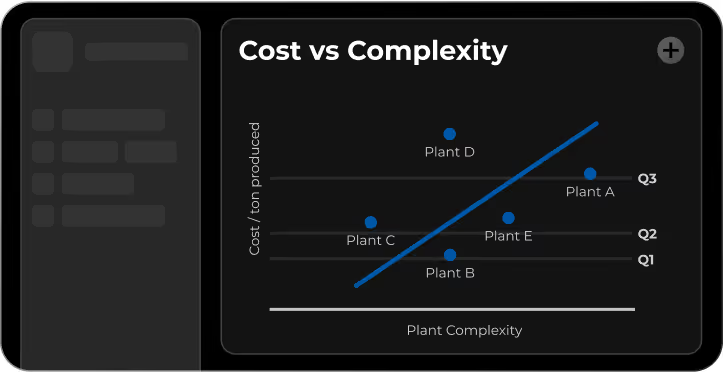
The Complexity Index ensures true apples-to-apples comparisons by adjusting for scale, automation, and product range. It benchmarks your plant against market peers across key cost areas, highlighting where competitors excel and how industry trends in automation and product portfolios shape your competitive position.
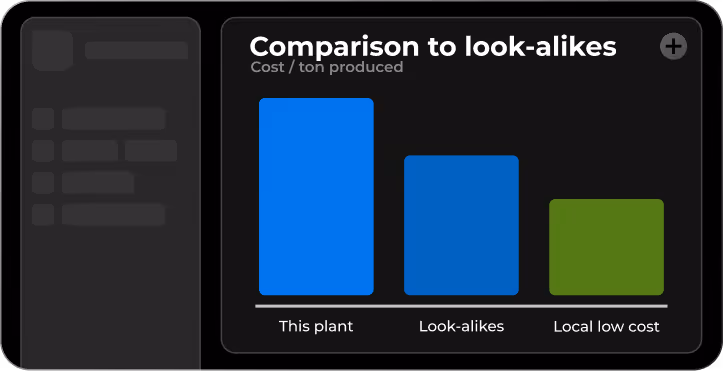
Look-alike benchmarking compares your plant to structurally similar top performers, revealing $500k average OPEX savings per site. With PAR modelling, we quantify expected manufacturing costs by scale, complexity, and automation, highlighting deviations from potential and simulating the impact of targeted improvements on operating performance.
Introduction and outline of timetable. Walk-through of data entry form & glossary.
Assemble initial data with support from pims.ai | malik.
Review/verify data gathered based on feedback from pims.ai | malik.
Submit final data.
Present and discuss the findings.
Draw inferences and set up action plans.

A North American blending plant faced high costs from ageing lines and low productivity. pims.ai's peer comparison identified inefficiencies and guided preventive maintenance, larger batch runs, and line upgrades — raising efficiency and cutting labour needs.
A state-owned manufacturer struggled with high costs and uncontrolled waste. pims.ai optimised staffing, batch sizes, and plant specialisation — improving efficiency, reducing losses, and lowering environmental impact through tighter operational control.
A toll-blender faced excessive labour intensity in warehouse operations. pims.ai benchmarking revealed root causes and guided palletised loading and streamlined handling paths — reducing touchpoints, speeding up load cycles, and lowering workforce demands significantly.


