

Talk to an expert


Working capital levels get scrutinized by the corporate treasurer when interest rates are high and profit margins are squeezed.


Working capital levels get scrutinized by the corporate treasurer when interest rates are high and profit margins are squeezed. Working capital forecasts get trimmed by the creative division accountant when his or her expansion-minded manager wants a pet project to clear the corporate hurdle-rate. Working capital increases get blamed by everyone when inflation helps businesses beat their profit forecasts but they still fall short on cash flow. No wonder there is continuous pressure to cut working capital, particularly when inflation is high and cash is constrained.
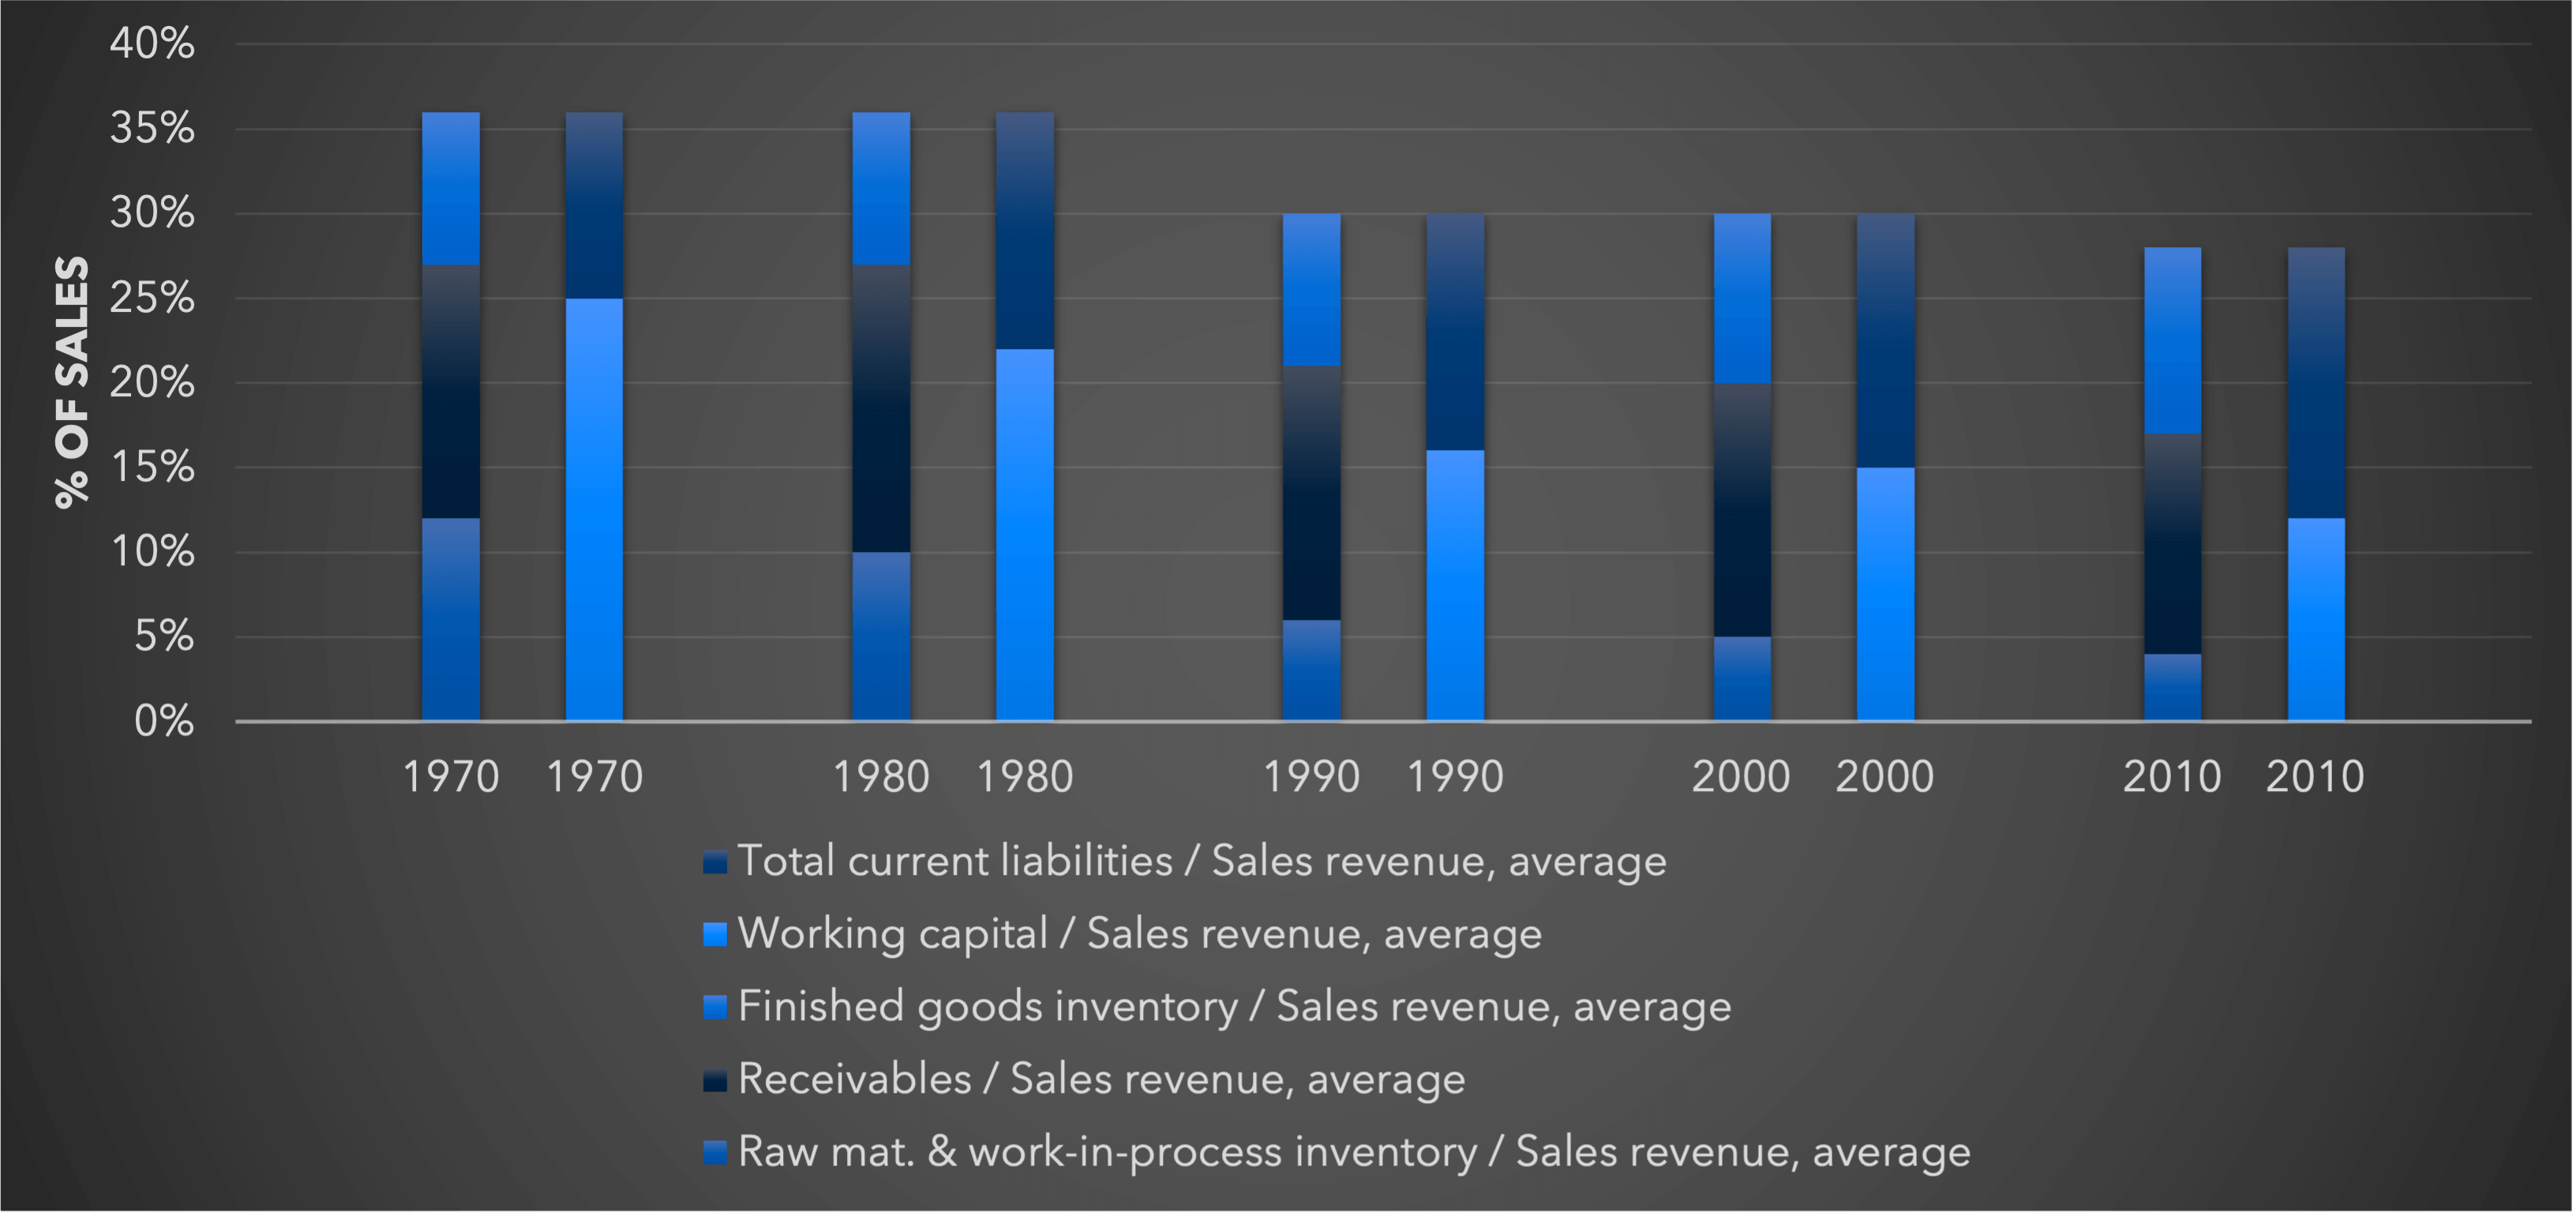
But most businesses need working capital. Their customers do not pay straight away. Stocks are needed to cushion against gaps between production runs and raw material shipments, and to protect against long lead times in the supply chain. There is a race be-tween increasing complexity and just-in-time service demands (which increase the need for stock cushions) and increasing efficiency of supply chains, sales forecasting, cash collection and stock control systems (which reduce working capital). The evidence from the PIMS database is that the latter have won: working capital to sales is one of the few ratios where we see a consistent downward trend over time - see Figure 1. This is an effect that is seen in the economy as a whole, but it appears to be even stronger in the PIMS sample (perhaps because PIMS findings focus managers’ attention on investment intensity). The reduction has mainly been due to raw materials + work in progress and some in-crease in payables.
A high level of working capital intensity (measured as the ratio of working capital to sales) hits cash flow from two directions: it reduces the ability of a business to generate cash, and it increases the need of a business to absorb cash (Figure 2). Cash flow is defined here as after-tax net income plus depreciation (cash generation) minus the sum of increase in working capital and capital expenditure, (cash use). Both investment and income are stated before financing and financing costs (interest and dividends).
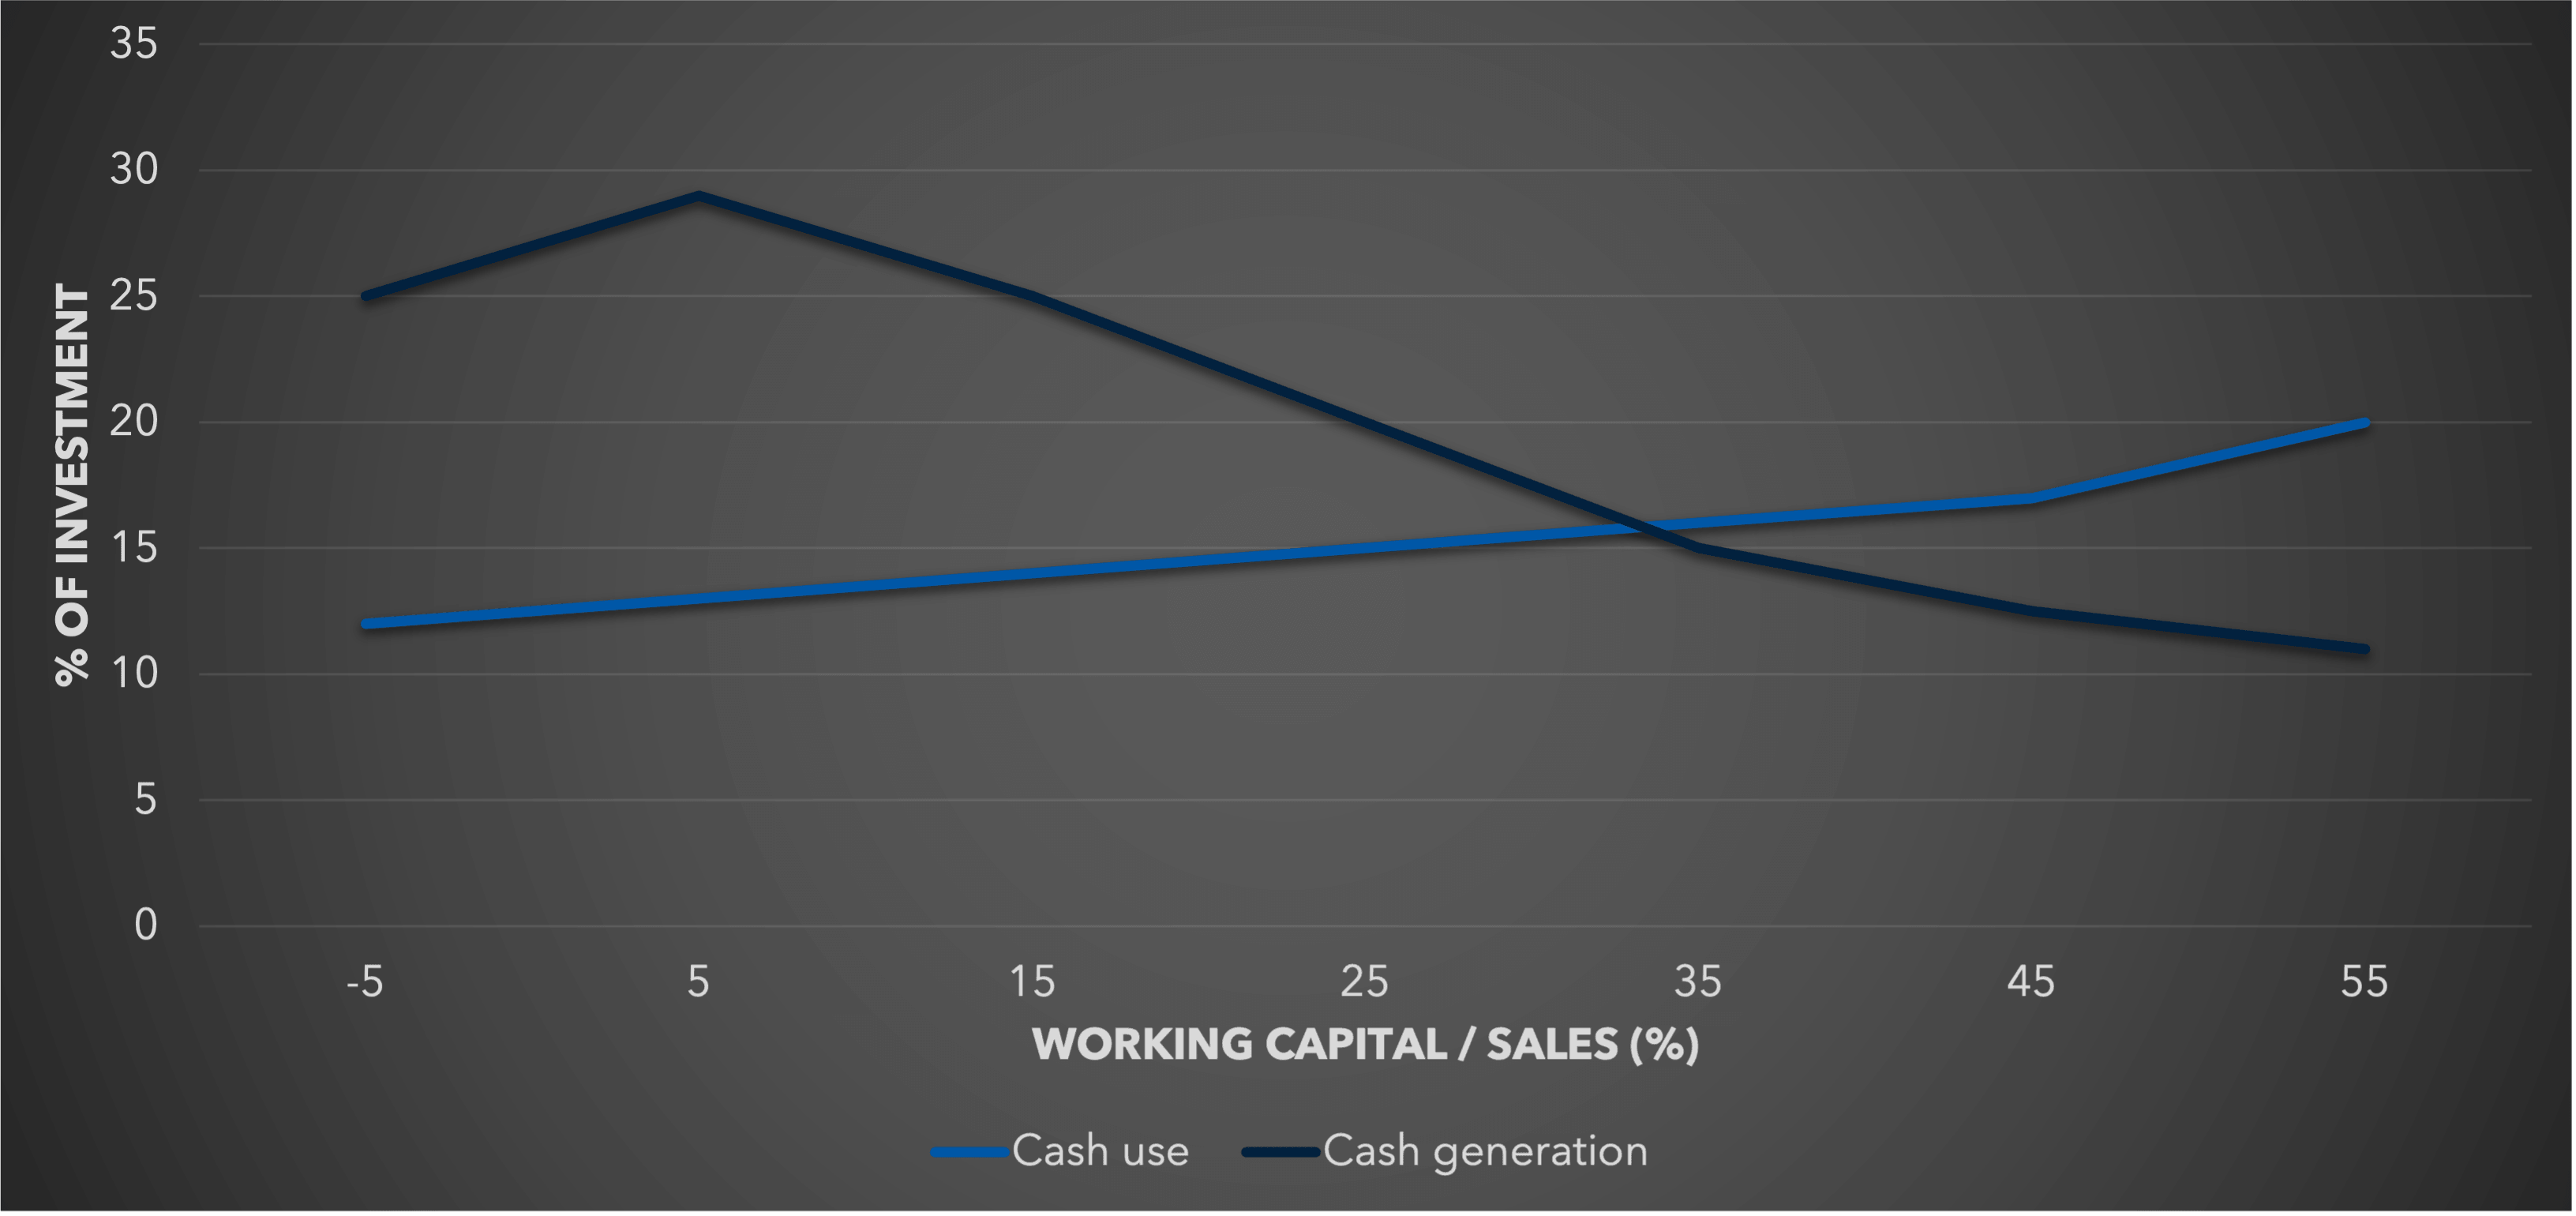
As working capital intensifies, cash generation decreases. This is because of the increasing “desperation factor” of asset-heavy businesses—they need to keep volumes high to have a chance of transforming the assets into cash, so indulge in marginal-cost pricing and other prof-it-reducing actions. Also, the denominator in cash generation / investment is higher so the ratio tends to be lower. On the other side of the ledger, cash use is a higher % of investment in working-capital intensive businesses (the difference even bigger as a % of sales). This is because as a business grows it is always possible to turn off the fixed capital tap, but working capital needs rise inexorably: each 1 % of sales growth requires a 1 % increase in working capital, and if there is a lot to start with there will be even more in the end, as a % of investment. So net cash flow gets scissored between the two lines: businesses with working capital over 30 % of sales typically have negative cash flows.
Managers want to know whether working capital can be cut without causing long-term damage to profits and cash flow. They want to pinpoint those businesses with the most leeway to make cuts, and to cross-check working capital projections for proposed new projects against realistic working capital requirements. Perhaps most urgently of all, they want to eliminate wishful thinking from cash budgets. To accomplish these goals, managers must understand the pressures that affect a business’s demand for working capital. They must also set objective benchmarks that take those pressures into account, and they must plan working capital needs accordingly.
The diversity of business experiences in the PIMS database enables us to see how strategic pressures shape the working capital profiles of different businesses. The ratio of working capital to sales varies from negative values to over 75 %. The inverse, working capital turnover, goes correspondingly from infinity to 1.33. However, as Figure 3 shows, most businesses lie in the range of 5 % to 25 % (or 20 to 4 turns). About thirty factors affect working-capital levels. Those that increase working capital in a business, and that lie somewhat within management’s control, comprise three main categories:
A fourth category comprises the strategic strengths that help a business to defuse pressures that tend to increase working capital. The more interesting effects in each category are detailed below.

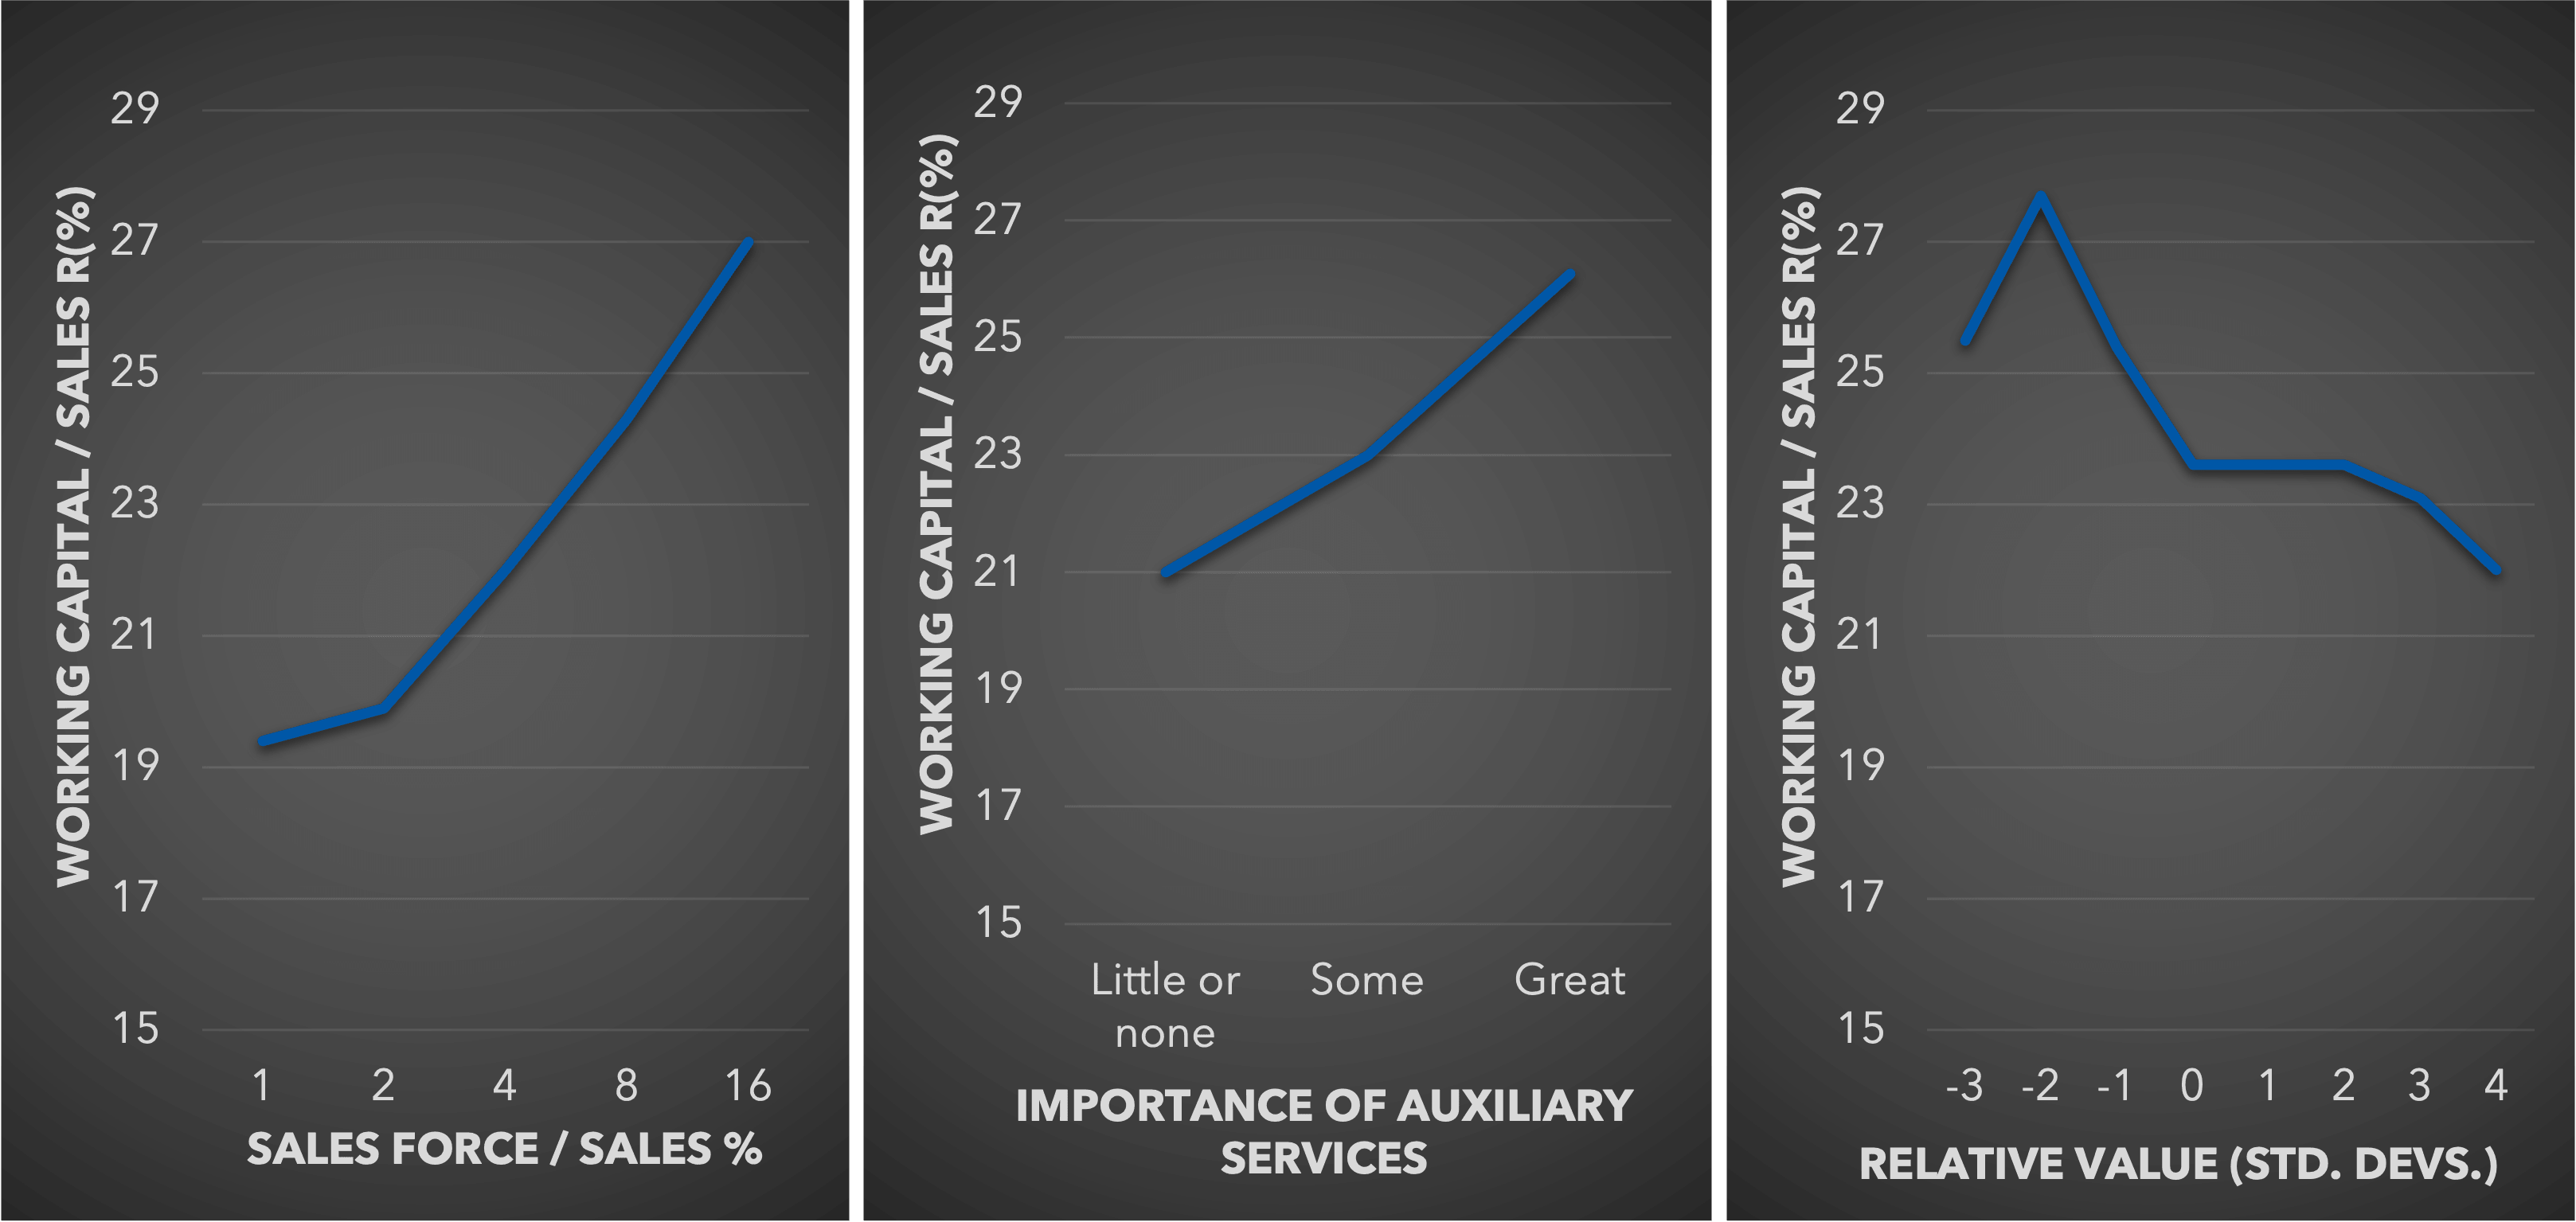
Working capital requirements are elevated in sales-driven businesses. One symptom of this is a large sales force. This can be both the cause and the result of an emphasis on extra sales. Another symptom is businesses where auxiliary services (warranties, after sales service, technical support, etc.) are important: these add complexity to the field activity. Sales push is particularly important when the value offering is perceived by customers to be inferior to competitors’ products. The evidence is shown in Figure 4. In all such situations, readily available inventory or relaxed credit terms can often make the salesperson’s life easier. It would appear that such temptations are resistible, and that an organizational solution is required to reward a large and powerful sales force on levels of receivables and finished-goods inventory as well as sales performance
Two factors that are related to the distribution system push up working capital levels. First, logistics and the sheer complexity of long-distance transport and international trade increase working capital. Both goods and money spend interminable periods in transit, wait for complex documentation, and sit out innumerable holidays. Second, the difficulty of predicting demand increases inventories in businesses whose products follow irregular and infrequent purchase patterns, or whose products change frequently, or whose products rely on artistic judgment for success. Such unpredictability pushes up working capital, since the gravy train will move on if you are out of stock. The effects of both logistical problems and shifting demand are shown in Figure 5: working capital gets pushed up by high export levels, geographically scattered customers, or infrequent purchases.
Again, in a well managed company, these pressures can often be resisted by “chasing” international transactions, getting better market information, and deepening the relationship with distributors.
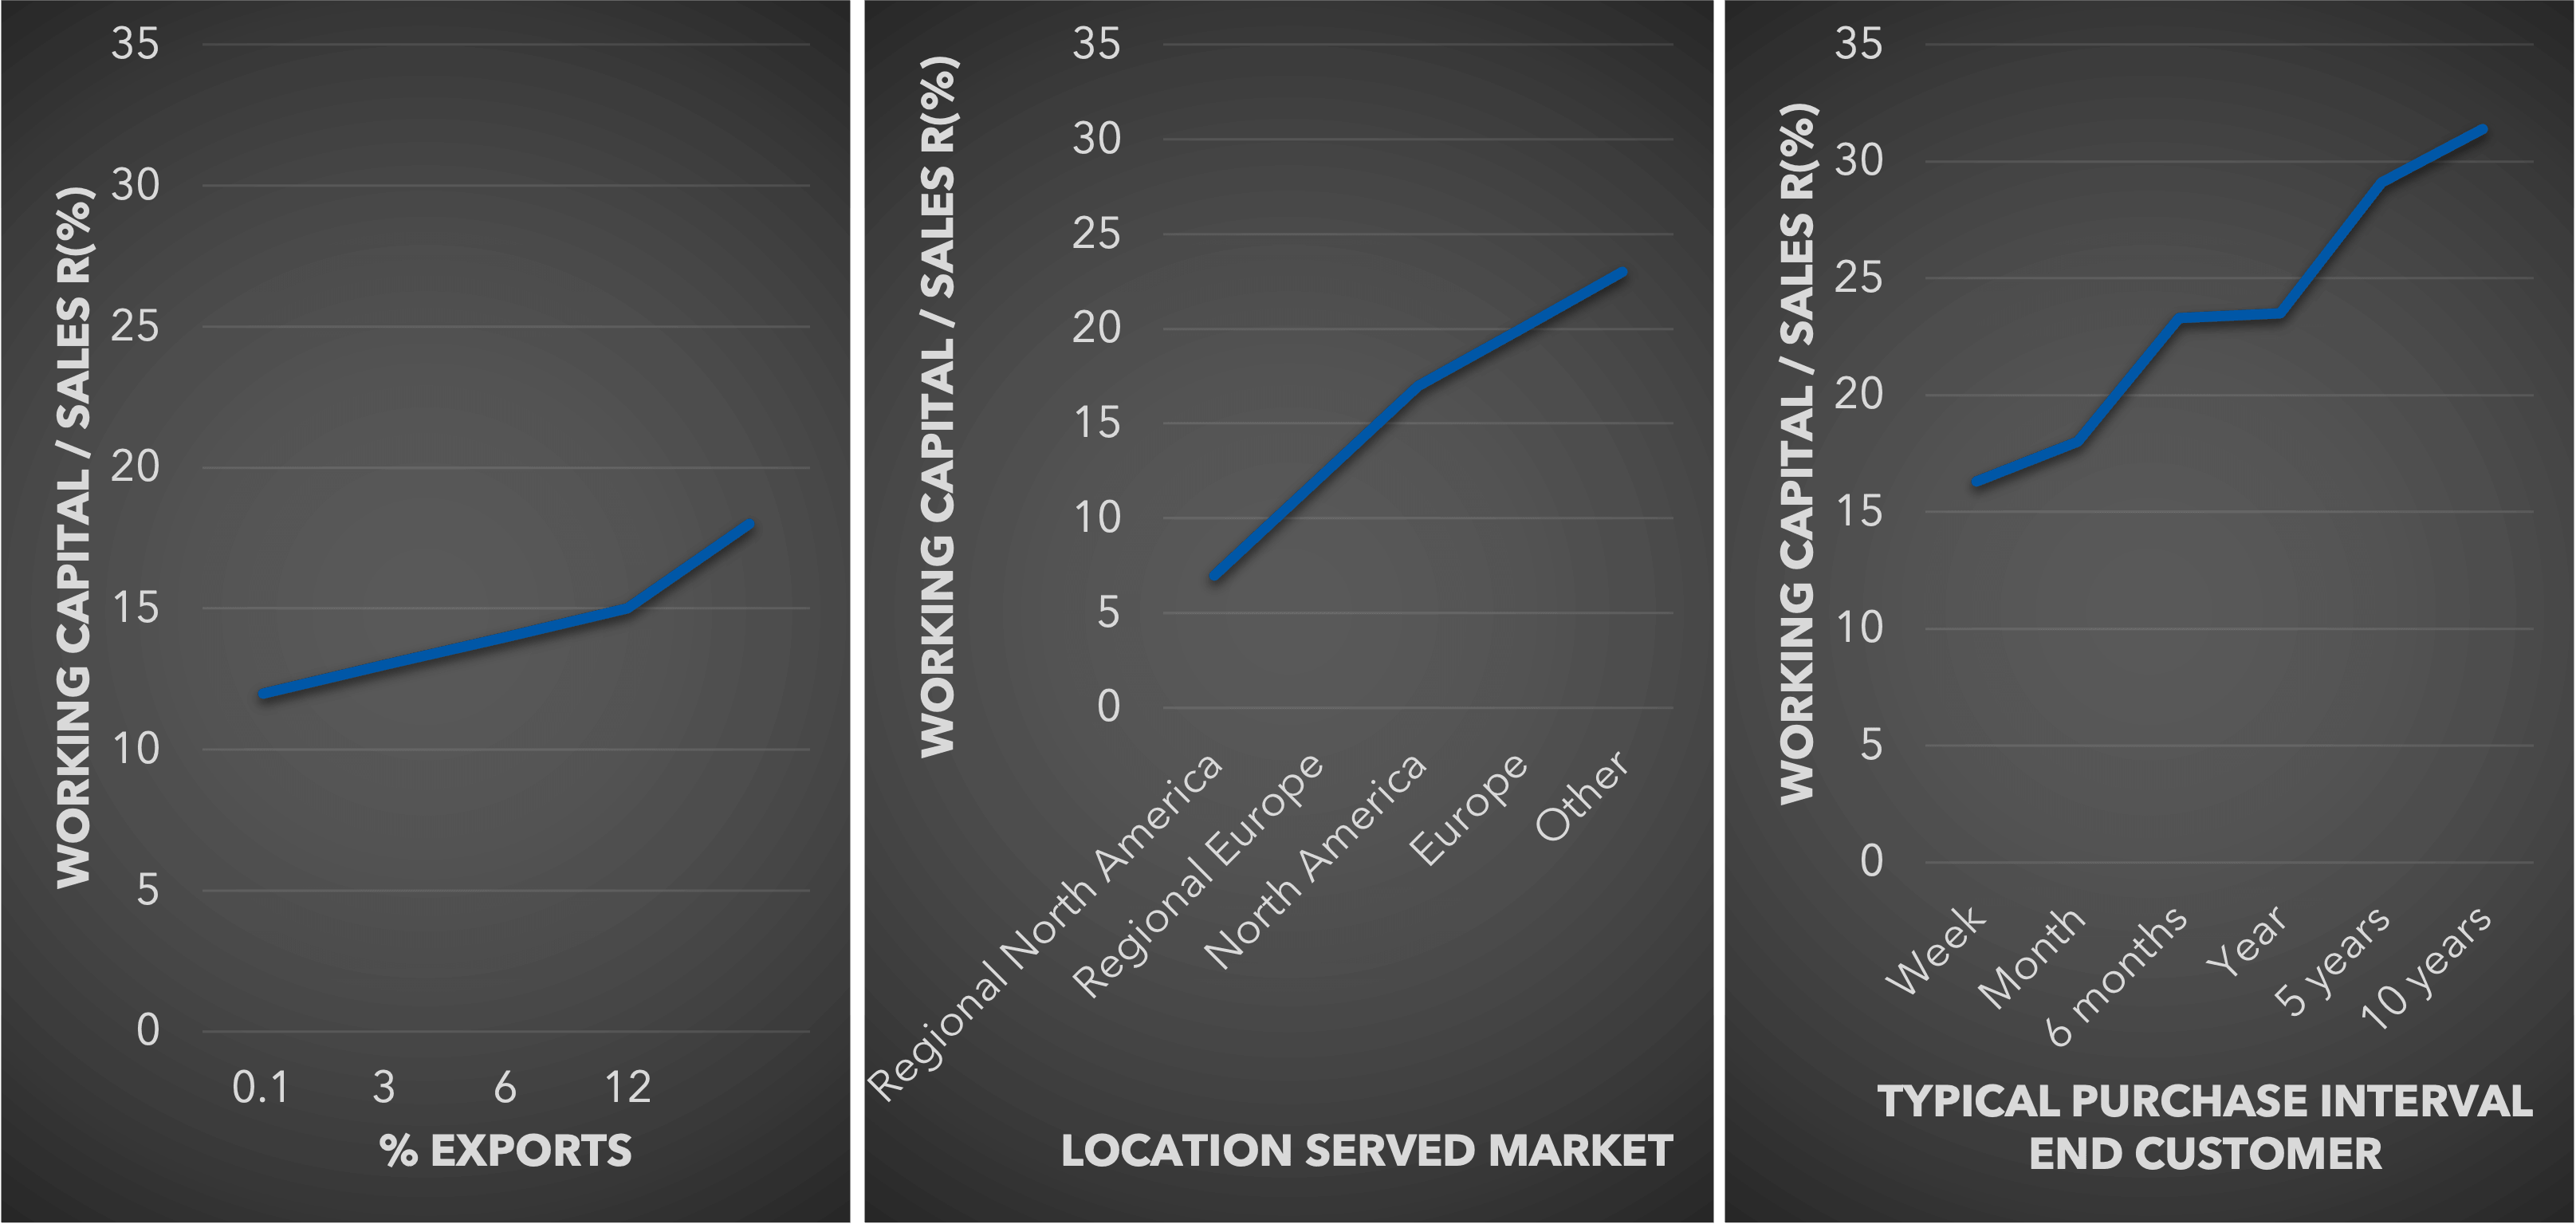
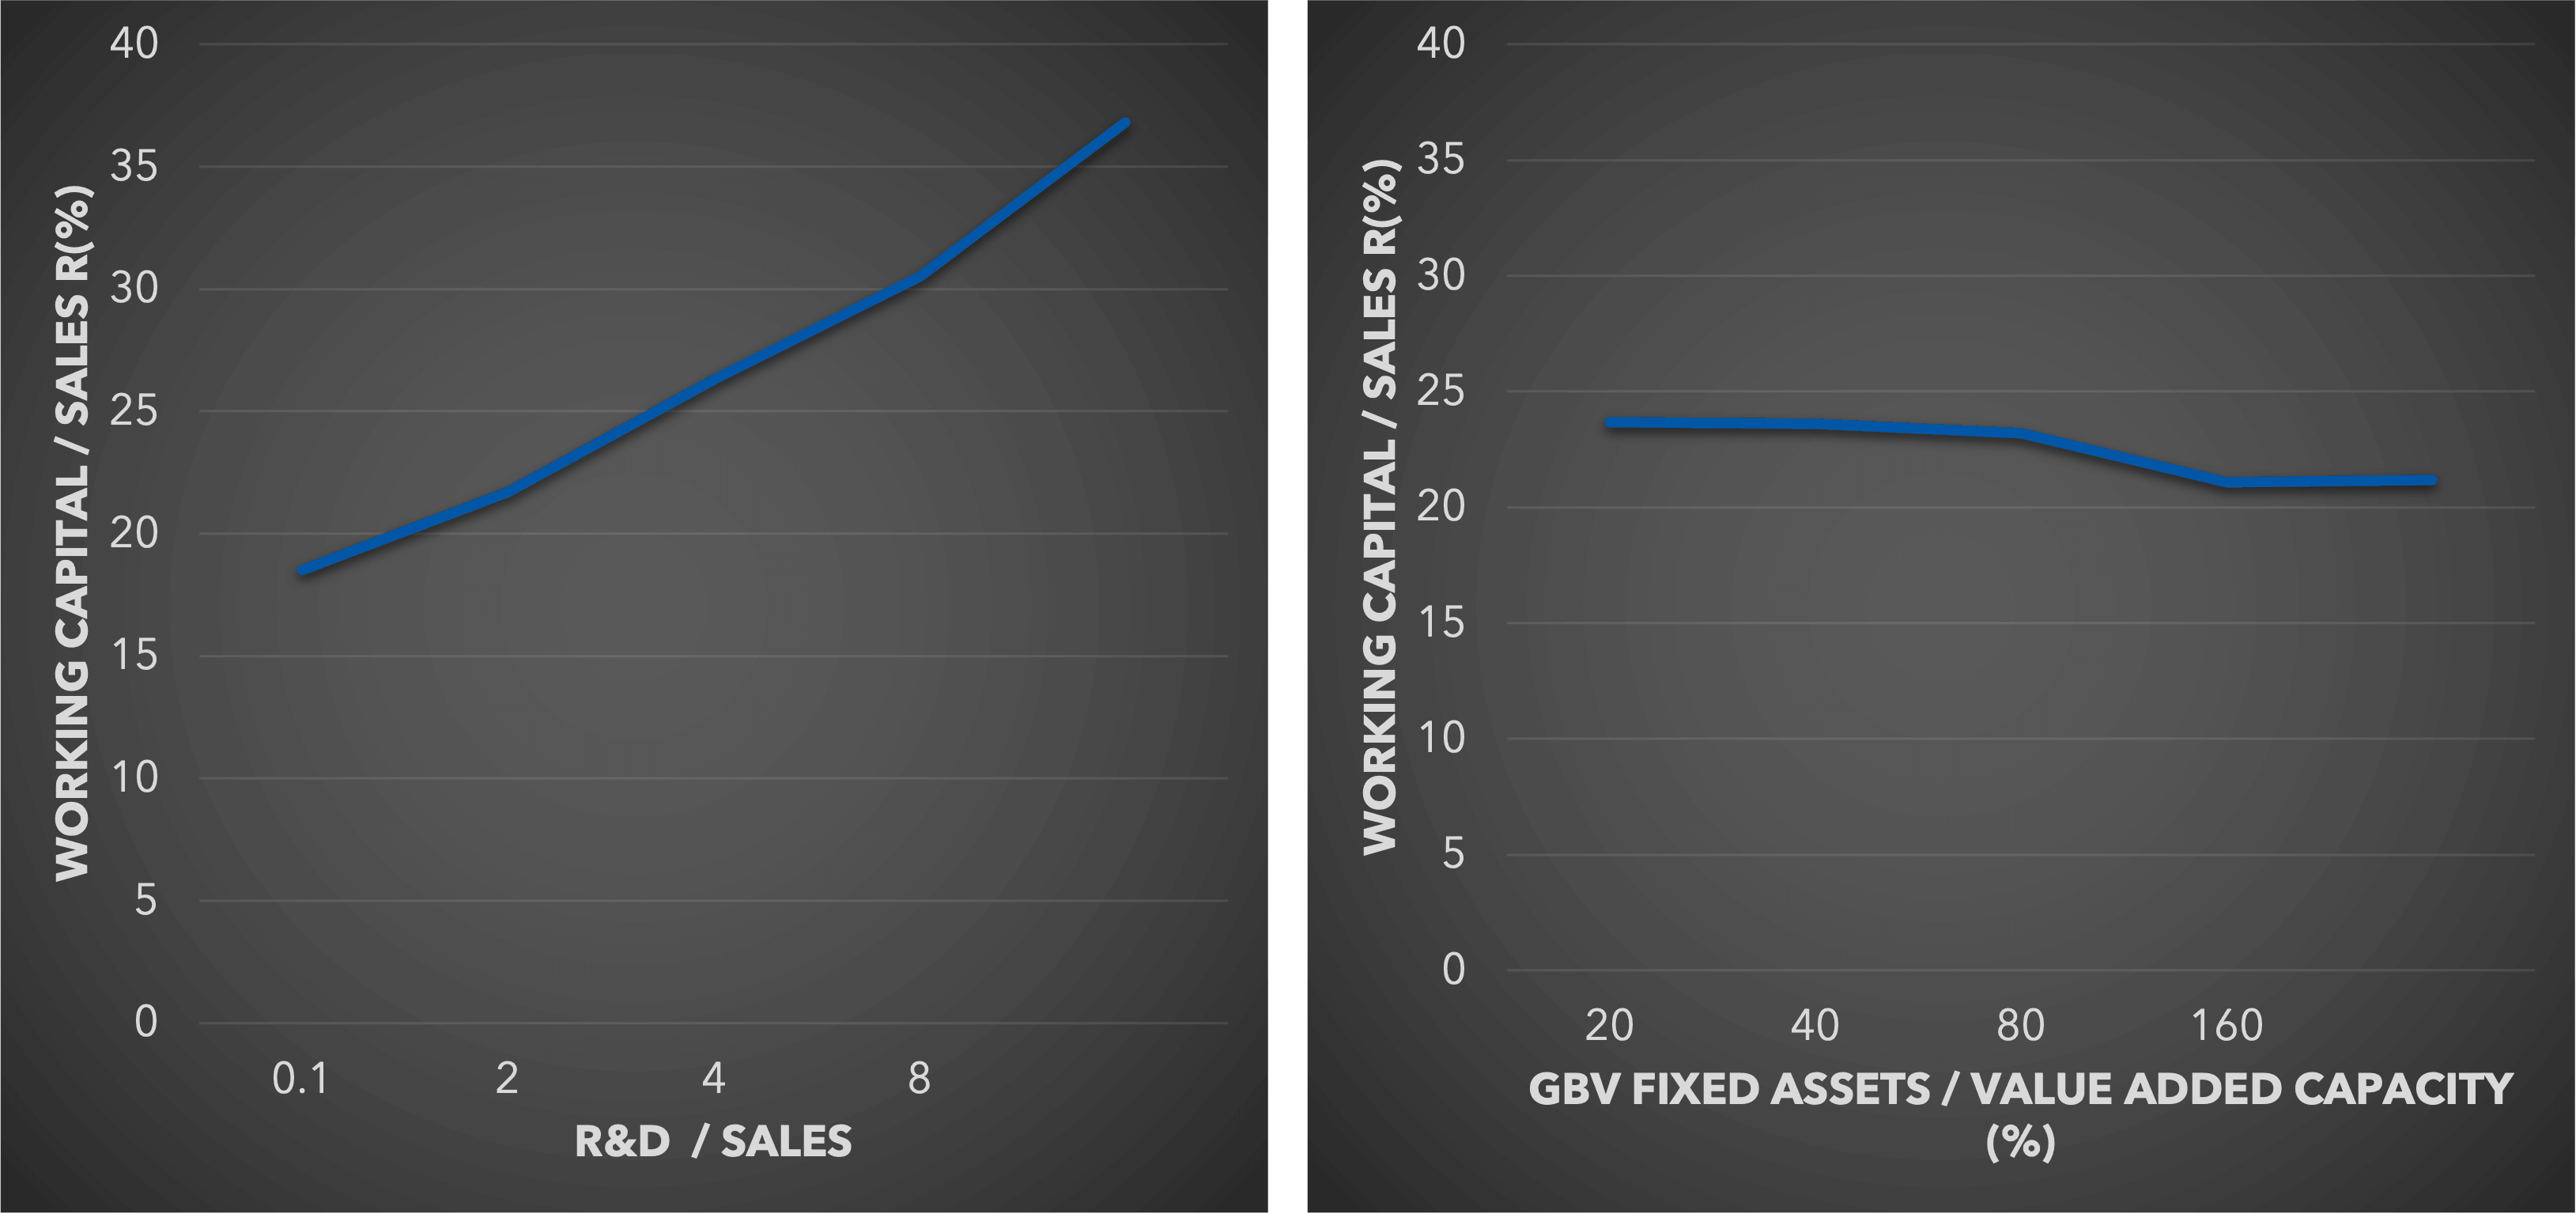
Figure 6 shows one important finding and one important “non -finding.” It appears that working capital is affected more by the complexity of production than by the quantity of production equipment. A high level of R&D usually indicates a high degree of technical sophistication, which can loom much larger in the production manager’s mind than inventory control. We measure fixed capital intensity by the ratio of gross book value (GBV) to value added capacity (Value added / capacity utilization): this corrects for different levels of capacity utilization. If anything this slope is weakly negative: higher mechanisation can reduce inventories slightly.
Adding bins of work in progress is a desperate remedy for continual breakdowns or complex machine scheduling; a well focused business would improve production engineering, production planning and quality control while rationalizing its product lines.
We have seen that pressing problems often cause a business to lose control of working capital. When the business has offsetting strengths, such as good market share or capacity utilization, management has more breathing space to deal with working capital (Figure 7). Businesses with these strengths achieve working capital economies of scale in many ways. A larger sales base accomplishes the following:
The slight uptick for businesses reporting capacity utilization over 100 % suggests that such situations are particularly stressed, and working capital control is not management’s top priority. Note also that these effects, while significant, are weaker than the ones above (in contrast to the effects of share and capacity utilization on profitability, which are very strong).
Even though businesses with a strong competitive position are most likely to achieve these savings, weaker businesses can still strategically manoeuvre to achieve similar economies—by taking steps like these:
Such manoeuvres have implications beyond their effect on working-capital levels. They should be considered, along with all aspects of strategic position, in the context of a full strategy exercise.

Many businesses track their working capital intensity against industry peers. This helps them allow for the idiosyncrasies of their industry. However, an industry norm does not distinguish among businesses within the industry. It gives no clues as to why the industry operates as it does, or how it might change. Typically, too, the information is only available at the 3-digit S1C level (e.g., “General Industrial Machinery & Equipment”), concealing real differences germane to particular market niches. The alternative is to track historical and planned working capital against a “par” value derived from the factors discussed in this document.
This benchmark complements (and often improves on) any benchmark derived from industry peers or corporate averages.
We saw in Figure 2 that high working capital drains cash flow. Not surprisingly then, above-par working capital levels do similar damage to cash flow. More surprisingly, there is no offset-ting benefit in terms of market-share gain. Contrary to what one might expect, businesses carrying above-par working capital gain share at the same (or lower) rate as businesses with below-par working capital (Figure 8).
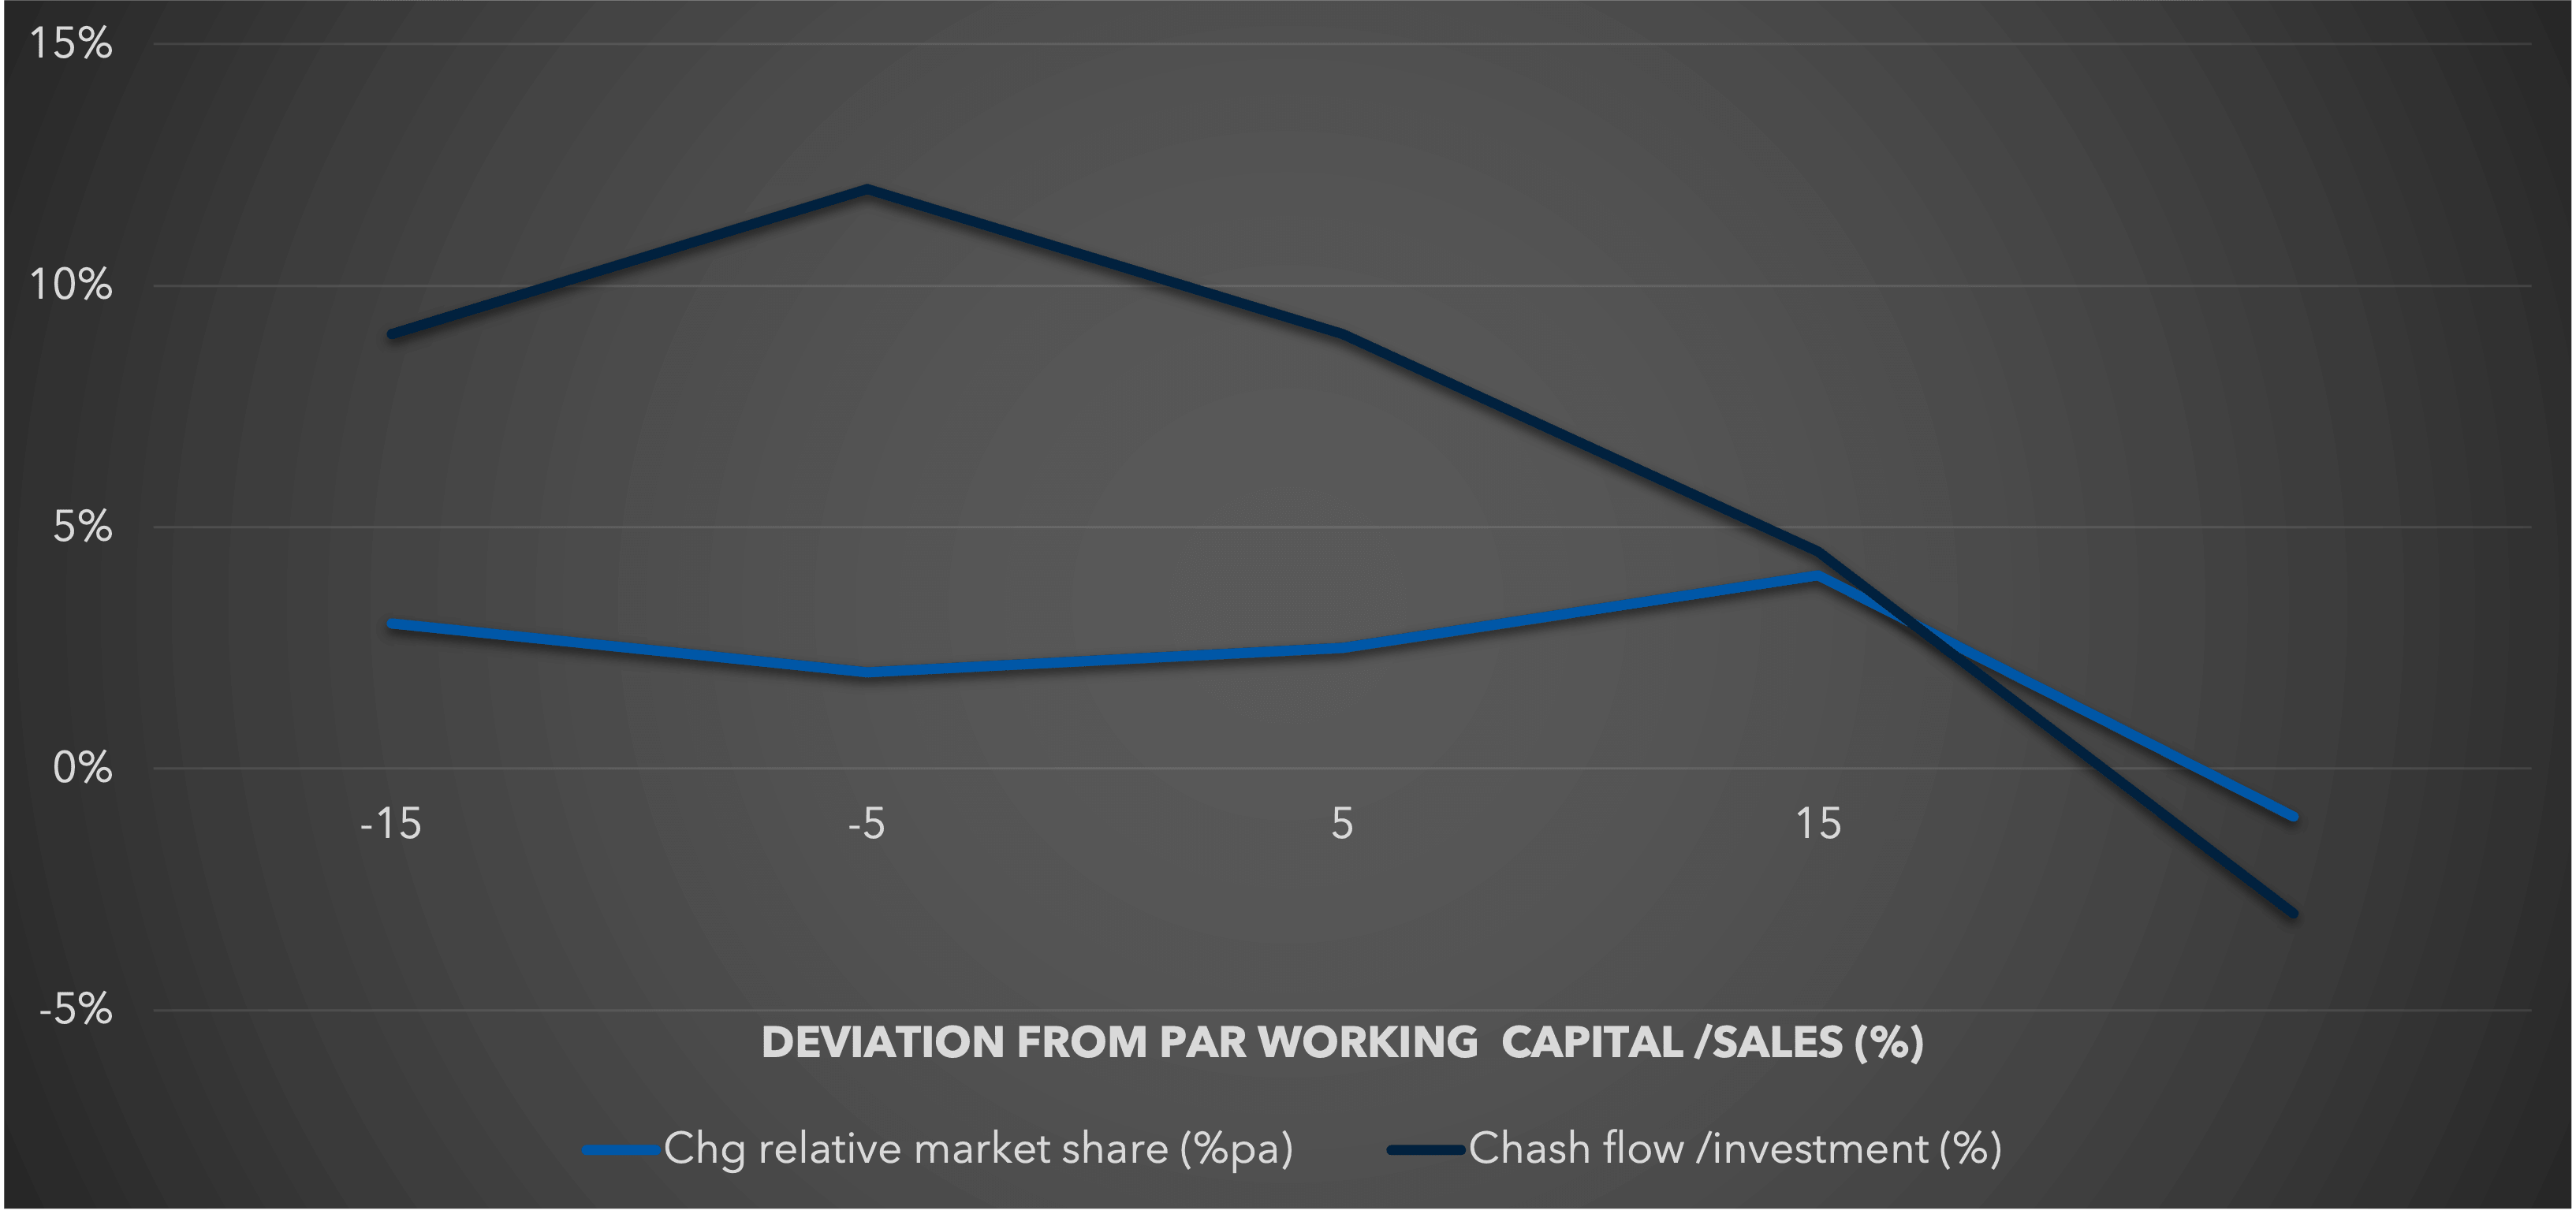
We are forced to conclude that a significant deviation from par measures management effectiveness rather than tactical aggressive-ness, though factors not present in the current PIMS database, like seasonality or perishability, may be important in specific cases. Half of the businesses in the PIMS database lie within 7 points of their par Working Capital / Sales ratio:
A business more than 7 points below par is in the top quartile in “effectiveness of working capital control.” So, how hard working is your working capital?
