Introduction
Lubricant manufacturers worldwide are facing a multitude of challenges. Mature markets, volatile raw material prices, tariff changes, difficulty of inventory management, suboptimal productivity, poor utilisation rates of equipment, high downtime and associated production capacity loss, energy inefficiency, high maintenance spend and turnover of critical employees are amongst the growing obstacles for global majors as well as independent players. There is an increased emphasis on understanding the drivers of performance that show the largest gap to best practice.
Some companies have a policy to aim for “best quartile” performance. However, this immediately raises difficulties:
- What should be the appropriate measure of success? Should operating expenditure be the sole barometer of success, or should losses, labour productivity, asset efficiency and safety performance be considered?
- What comparison sets to use? Should this be a country, a region or a global comparison? Should this be versus global majors, independent players or both?
- Since labour represents the biggest portion of operating expenditure, and pay rates are location dependent, should pay rates be normalised, since a plant cannot change its location?
- Since complexity is the biggest driver of operating expenditure after labour, and generally intrinsic to a plant’s mission, how to correct for differences in that?
- Since scale of operation is also a key cost driver, should the performance evaluation correct for that?
- What about other“givens”such as proximity to suppliers, order sizes, lead times, access to secondary warehouses, etc.?
Over the last 30 years, PIMS has provided lubricants and greases manufacturers with concrete recommendations to improve their competitive position based on objective evidence. Based on our research and experience, some plants consistently and substantially outperform their regional peers. These regional champion plants have a significant cost advantage versus peers, operate substantially below their expected1 cost thresholds and attain a superior productivity position.
In this paper, we will explore the profile and key attributesof the champion plants that enable them to have the upper hand versus competition.
Overview: Americas
In the 2016-2017 cycle of the PIMS® Lubricants and Greases Benchmarking, the average volume of finished lubricants produced by a plant in the Americas region was 77,700 tons. Although the median volume in Latin America has remained stable at around 32,000 tons per annum, the North American median has fallen from 92,000 tons in 2010-2011 to 80,000 tons in 2016-2017. The aggregated complexity index2
Profile: Champions versus regional peers
The average annual throughput of the champion lubricants manufacturers in Americas is 128,500 tons, whilst other plants in the region (the “peers”) have a significant scale disadvantage with an average throughput of 66,000 tons.
In Figure 1 we see that the product portfolio of the champions aligns with that of the peers, with motor and hydraulic oil accounting for almost 90% of the portfolio. For the champions, 65% of the volume is produced using an inline blender and the remaining via automatic batch blending. In contrast, although 83% of the peers’ throughput is produced via in-line blending, the remaining 17% is carried out by manual batch blending.
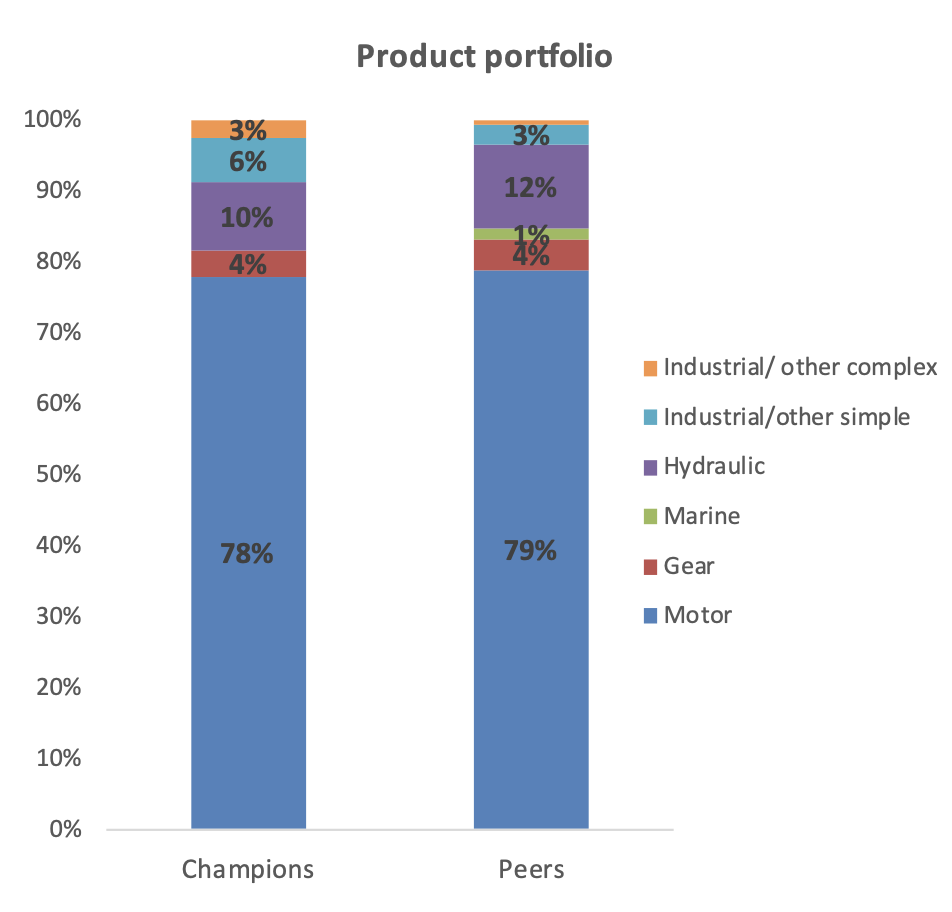
Figure 1 showing the product portfolio of the champions and peers in Americas
Despite an almost double annual throughput, the average volume packed by the champion plants is 50,300 tons whilst the peers are packing 37,000 annually. This higher proportion of bulk is one aspect that enables the champions to have a less complex operation. Figure 2 below shows the packing distribution of the champions and the peers. Although the large pack (i.e. greater than 10 litres) to small pack (i.e. less than 10 litres) ratio is similar between the two groups, the champion plants are filling less into drums and more into pails and 3-10 litre packs. It must be noted that kegs and <0.9 litre packs are not prevalent in this region. The average automation index3 for the small pack and large pack filling lines are identical for both groups at 100% and 50% respectively.
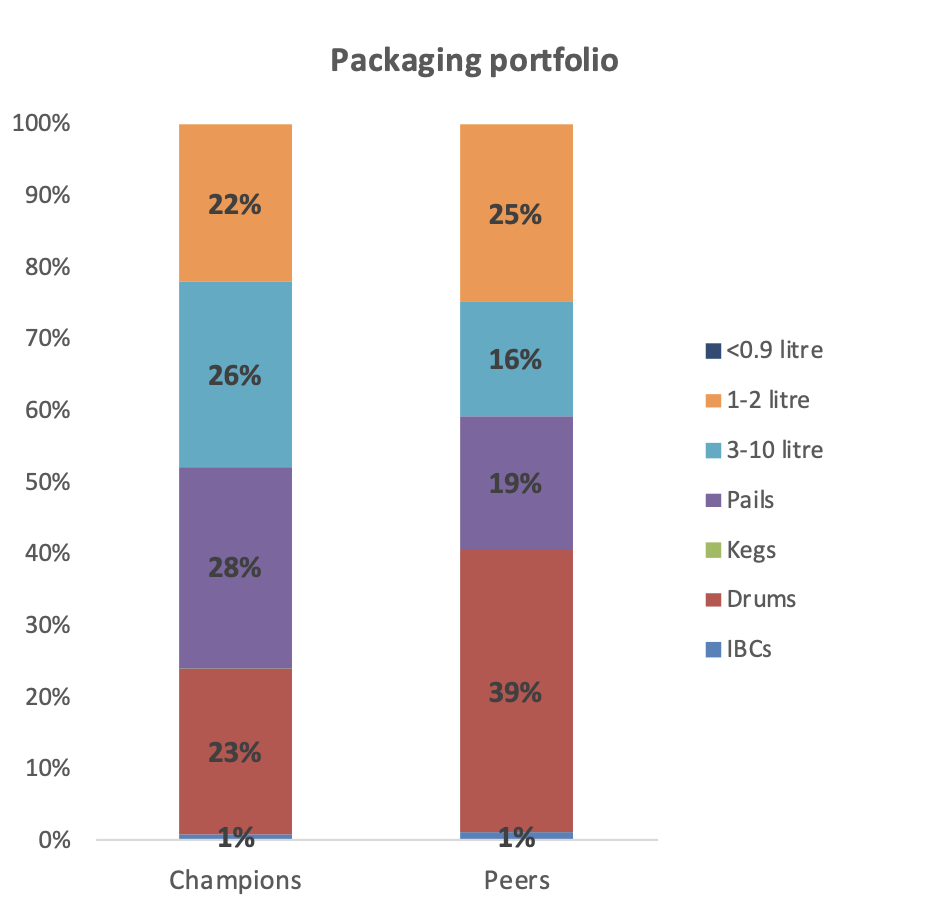
Figure 2 showing the packing portfolio of the champions and peers in Americas
Productivity and batch sizes: Champions versus the rest
Table 1 below shows the productivity (FTE = Full Time Equivalent) of the champion plants versus the peers in Americas across all core activity areas of the plant.
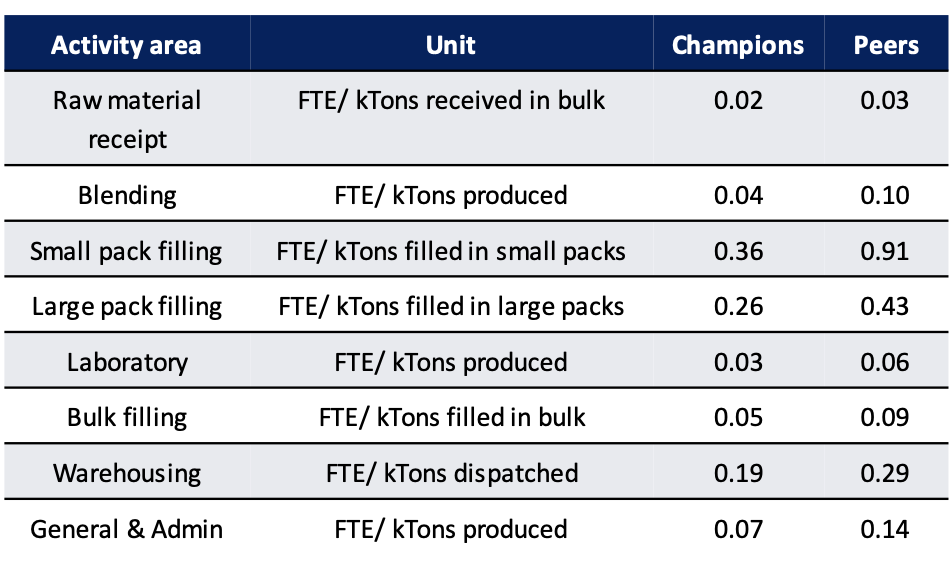
Table 1 showing the labour productivity of the Champions and peers across core activity areas of a lubricant manufac- turing facility
The champion plants in Americas have a better productivity position across the board. In labour intensive departments such as small pack filling, the champions require 60% fewer people in comparison to the champions, whilst in large pack filling they use 40% fewer. In addition, the in-plant General & Administrative operations are significantly more streamlined. In the Americas, 60% of the plant OPEX arises from personnel related costs such as salaries, benefits, social costs, etc.. Streamlining this effort enables the champions to gain a competitive advantage versus the peers. Of course, part of the equation is the overall size of the plant – champion plants fill 36% more in comparison to their peers. However, the differences are such that mere scale effects do not fully explain the advantages the champions manage to have. What is it about the processes of the champions that promote productivity over and above simple scale effects?
Figure 3 below shows the average batch size by blending equipment of the champions versus the peers. Although over 80% of the peers’ throughput is produced via in-line blending, their much smaller manual batches drag down their overall average. When evaluated on a product type basis (see Figure 4), champion plants’ batch size for motor and hydraulic oil (which accounts for ~ 90% of the portfolio) is 32% and 13% larger respectively. Despite the larger batches, the average blending time per batch for the champions require approximately 30 minutes less in comparison to peers (2.96 hours per run for the champions versus 3.36 for the peers). The economies of scale in conjunction with faster utilisation rates boost productivity in the production department.
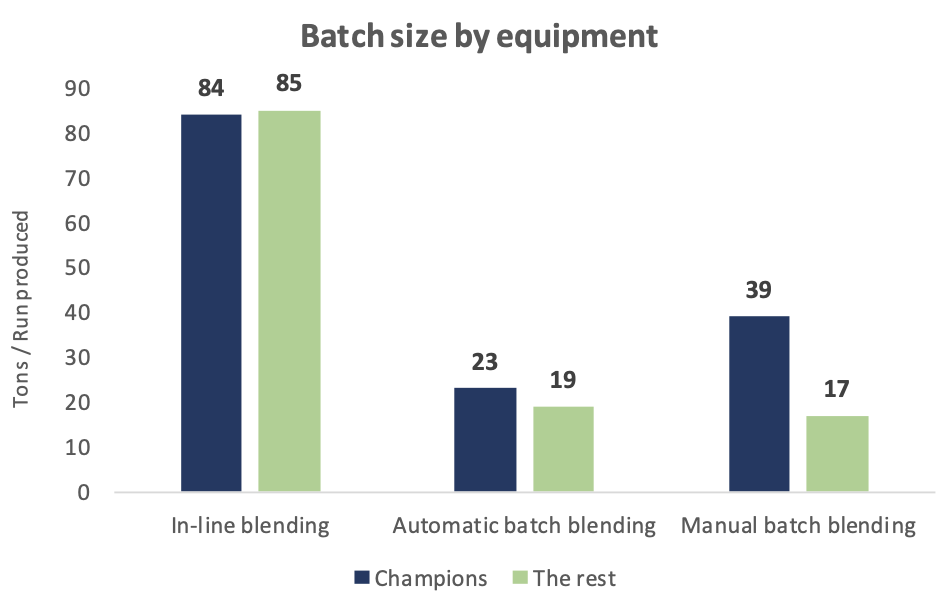
Figure 3 showing the batch size by blending equipment
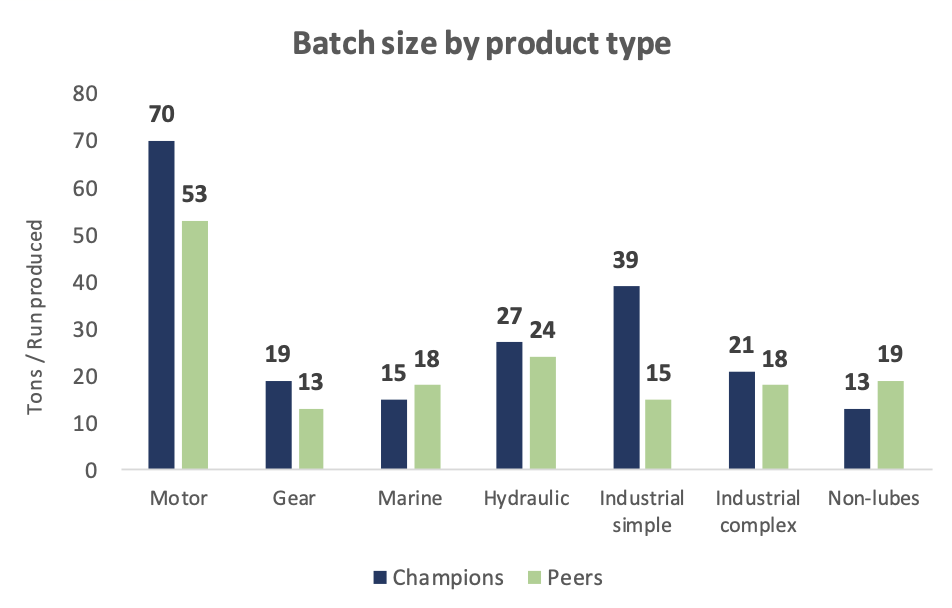
Figure 4 showing the batch size by product type
In the large pack filling department (see Figure 5), the regional peers have a 2.5 ton run size advantage in Drums in comparison to the champions. However, champions fill almost 30% of their throughput into Pails, and here there is a ~3 ton per run advantage versus the regional peers. For less than 10 litre packs (see Figure 6), the average run size for the 3-10 litre packs for the champions is more than double the peers.
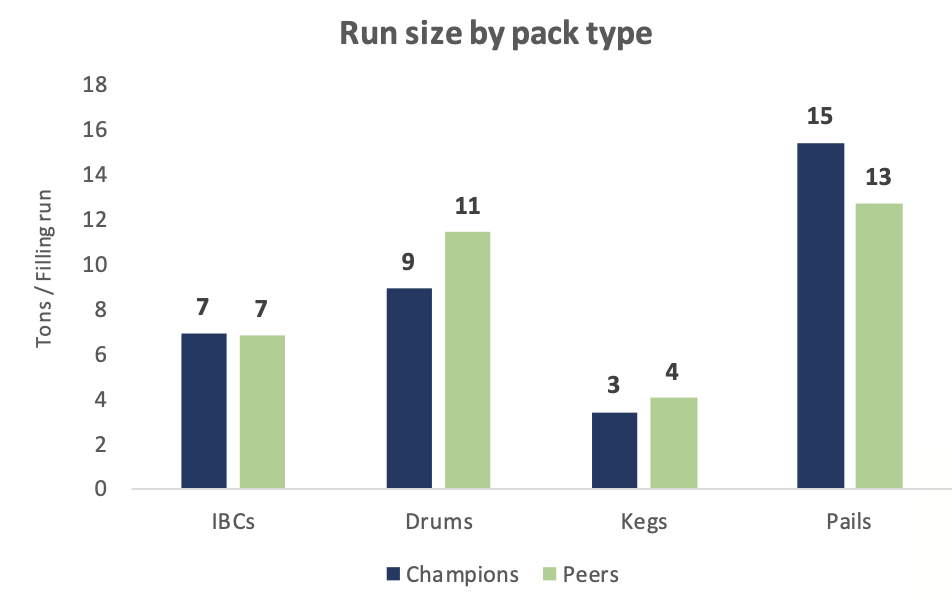
Figure 5 showing the average run size for large packs (great- er than 10 litres)
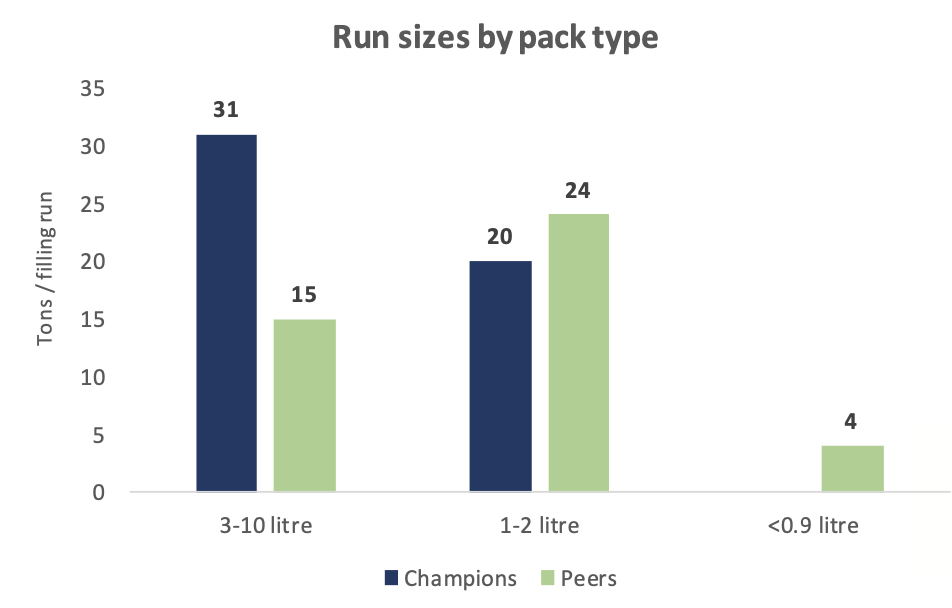
Figure 6 showing the average run size for small packs (less than 10 litres)
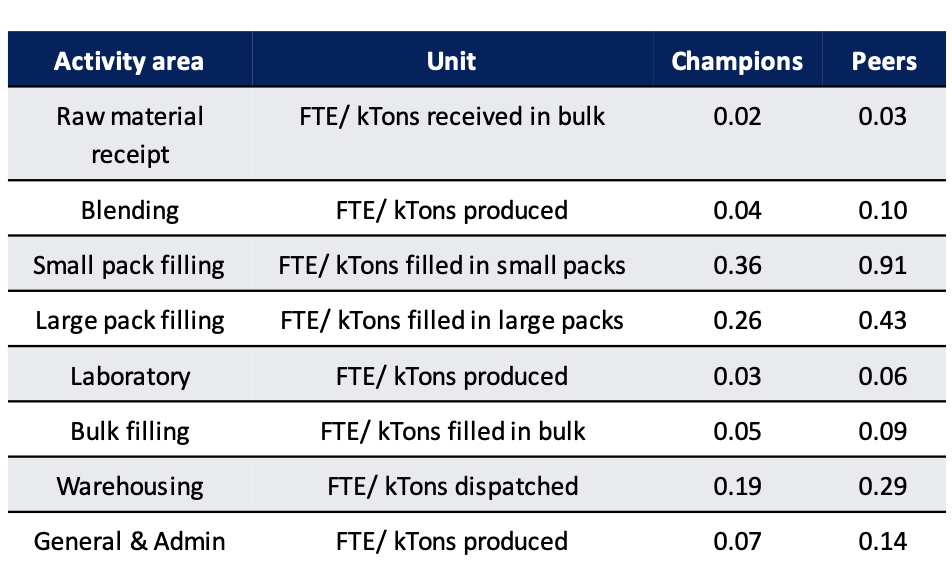
Table 2 showing the OEE and component scores for large and small pack lines
Table 2 above shows the aggregated OEE4 and component scores for the large pack and small pack filling lines for the champions and the regional peers. The champion plants manage their filling operation with fewer unplanned stoppages and are better at managing the planned downtime and thus outperform their peers on Availability. The utilisation rates of the champions (as indicated by the Performance aspect) for the large packs lines are significantly higher than the peers, although there is significant spare capacity for the < 10 litre lines. Thus, bigger batches, higher utilisation rates (for large pack lines) and well managed downtime boosts productivity in the packaging department. The quality component of OEE is very well managed in Americas. The OEE results indicate that significant investment in newer equipment is beneficial providing the labour productivity improves significantly.
Summary
The champion plants in Americas are exploiting economies of scale by producing and filling the finished lubricants in bigger batches in comparison to their peers. This, in conjunction with better utilisation rates, lower complexity and well-managed downtime boosts productivity. Ultimately, this streamlined effort enables the champions to have a significant competitive advantage versus regional peers. Champions get to the top by being better managed and more aligned with the rest of the supply chain – not by having more or newer equipment. There is a significant time delay between the installation of new equipment and the reaping of the benefits – which in turn also depends on how well managed the plant is. Champion plants typically invest modestly and focus on few but important goals. This is not the result of magic or coincidence but hard work and professionalism.
1 Mathematical model that quantifies the expected operating cost of a manufacturing plant, given its strategic profile.
2 The PIMS® complexity index quantifies the difficulty of the job the plant is undertaking and is driven by variety. The higher the variety handled by the plants (i.e. formulations, SKUs, components, etc.) the more complex the operations. The least complex plant worldwide has a complexity index of 0% whilst the most complex one has a complexity index of 100%.
3 PIMS compartmentalises filling & packing in 6 core steps: Empty pack feeding, pack orientation, filling, capping, labelling and palletising. The automation index is derived by taking the proportion of steps that are automated.
4 Availability takes into account all events that stop planned production long enough where it makes sense to track a reason for being down. Performance takes into account anything that causes the manufacturing process to run at less than the maximum possible speed when it is running. Quality takes into account filled packages that do not meet quality standards.