The dreaded call comes from corporate centre: “We’ve decided to benchmark your operations against best in class, please complete the attached data form”. Your heart sinks: you know that you will be put into a league table against all sorts of strange and inappropriate comparators who define all their performance metrics differently from you. You will eventually be told “best quartile is X – please submit a plan to achieve this within 18 months” – even though by so doing you might destroy the business. However much you say “But my business is different!” the answer will not change.
There is so much bad benchmarking done that there is a danger that the whole idea will be discredited. As someone who has spent the last 30 years trying to develop ways of doing good benchmarking, we find this tragic. This article is my attempt to say what we think distinguishes good benchmarking from bad benchmarking, so that the true benefits can flow. These benefits can include:
- Objective evidence of where you stand against peers. Having firm facts to base decisions on, rather than wishful thinking, means you can avoid making wrong competitive moves. There is nothing crazier than starting a price war when you think you have a cost advantage and in fact you don’t.
- A good understanding of the true drivers of performance. Most managers appreciate that their costs depend on product complexity, customer complexity, scale, location, service levels, plant configuration, planning processes, etc.. With a diverse database of peers who vary along all these (and other) dimensions, research can show empirically which of these potential performance drivers actually make a difference in the real world, and by how much.
- Quantified and prioritised areas of improvement: how much of an improvement is needed and what is the prize?
- Better information systems: benchmarking makes it worthwhile to measure things because it gives a valid comparison on each metric used.
- A stimulus for change based on clear evidence versus real peers.
- The reassurance to everybody, where “hard change” is indicated, that the change is really necessary.
- A basis for analysing alternative future scenarios using real experiences of others who have been there already.
In this article we describe six pitfalls of bad benchmarking – so that you can recognize when you are doing something wrong – and six pillars of good benchmarking– so that you can push for them to be incorporated in future projects.
Pitfall 1: insufficient care over consistent data definitions
It amazes me how often people get this wrong. If you are comparing labour costs, for example, it must be clear whether these include or exclude social costs, benefits, pension top-ups, training, transportation, etc.. What about contractors as opposed to employees? Do you allocate a proportion of head-office people to each operating unit? How to report purchased services like security and maintenance?
Of course, at the most granular level, every operation will have some unique aspect that has to be corrected for. Sometimes that will be by making an appropriate adjustment, sometimes by making no adjustment but noting that there is likely to be a distortion in the final comparison. At a Japanese warehouse we analysed recently, the contracted staff looked very expensive till we realised that they brought their own fork-lift trucks. We then had to estimate what proportion of their cost was really labour and what proportion was energy/ maintenance/depreciation for the fork-lifts.
The important rule is to produce a glossary of definitions that is strong on principles (and the reasons for the principles) and copiously illustrated with examples. It can and should never aim to be 100% comprehensive.
The problem with any glossary is that it answers every possible question except the one you’ve got: hence the emphasis on principles rather than rules. The glossary should be incorporated in the data collection instrument (e.g. as comments on an excel spreadsheet) so that users don’t have to spend time fighting their way through a thick book.
Data should always be checked and re-checked in as many ways as possible. Often there are simple diagnostics (Do totals add up? Is X greater than Y+Z? Is A roughly equal to B/C?) that can be incorporated directly on the data collection instrument so the user can see immediately when there is a potential problem. Before performing any analysis, all input ratios, growth rates, etc., should be compared to upper and lower limits (e.g. 10%ile and 90%ile) and the question asked: “would you expect to be extreme on this?”
My experience is that consistency requires one-to- one meetings (either virtual or physical) between the benchmarker and the data provider, usually after the first submission. Somehow, of course, the tax man manages the trick without, but even he reserves the right to a hands-on audit if he’s dubious.
Pitfall 2: too much work to assemble data
My view (not always shared by my colleagues) is that a benchmarking data form should be a maximum of two A4 excel sheets. As a benchmarker, you should work with a “champion user” to come up with a data set that captures all the important performance metrics – and the factors that are likely to make a difference to performance – in a form readily captured from the main IT systems, or a quick walk round the facility, or the top of knowledgeable managers’ heads. It should then take a competent analyst < 3 days to interrogate the systems, tour the plant, interview the knowledgeable managers, and complete the data.
As a matter of principle you should ask for raw totals or indices rather than averages or percentages or growth rates. Then consistency checks are usually simpler, and if someone makes an error in the maths it’s you.
Pitfall 3: inappropriate success metrics
About the only unequivocal success metrics relate to customer perceived value: if customers perceive that you are delivering a superior product for them at a great price, and are staying loyal, that’s a good thing. Other metrics like low cost, high productivity of labour or capital, rapid growth, new product innovation rate, staff turnover, right-first-time rates, etc. only show one element of a balanced scorecard, and if you are forced to optimise one you may be able to do so by sacrificing many of the others. My experience with benchmarking “loss of face” factors (e.g. lost time accidents, quality incidents) is that many companies go to extraordinary lengths to manipulate the figures, e.g. by giving manual workers with broken limbs some clerical chores to do, so they won’t be categorised as “off work”, or inventing a “low spec” product.
So my recommendation is to benchmark the widest range of metrics – money, time, quality, health / safety / environment (subject to pitfall 2 above) – that are relevant. Praise managers who are willing to lose face. Only include success metrics for which the entity’s management is clearly responsible.
Pitfall 4: wrong choice of peers
The first mistake in many cases is to restrict the comparison set to direct competitors. Obviously for some things – particularly production-related ones – only competitors have comparable processes. But for many things, particularly marketing, R&D, HR, finance, IT, logistics, and even for many production overhead processes, you can look outside your industry for analogous peers facing similar enough challenges in similar enough environments. The PIMS (Profit Impact of Market Strategy) database has proved that cross-industry comparison is valid even at the level of profitability, growth, and business strategy.
Small competitors often try to copy the most successful big player in their industry. The military equivalent of this would be to say “who has the strongest army, what terrain are they best at fighting on . . . let’s attack them there”.
A small competitor should benchmark against other small competitors in analogous markets and see what the winners do to differentiate against big successful players. Similarly, market leaders should learn from best “look-alike” leaders.
In general, the best comparison is against peers who are like you in terms of the intrinsic challenge (the drivers of performance outside management control) but are doing a better job than you in terms of the drivers within management control.
Pitfall 5: simplistic league tables
Imagine you are a plant manager who is told he is in the worst quartile of inventory control because he has 60 working days of raw material stock. Best quartile is 10 days. Unfortunately his raw material comes by ship from 3000 miles away, and the cost-efficient thing is to have two ships a year. So each delivery comprises 120 days of raw material (5 days/week, 48 weeks/year), and going down from 120 days to zero the average stock must be half 120, i.e. 60 days. He can of course get down to <10 days, by subcontracting someone else to receive the two shiploads a year and truck some to him every week. But that just creates an intrinsically longer and less efficient supply chain.
If the problem is something else even more outside his control, such as greater complexity or higher service levels or less flexible production equipment, he can only get to first quartile by changing the job he has to do. While this may be a relevant discussion for him to have with corporate centre, it is counter-productive to tell him he is “not world class”. He may be, he may not be, but always he is convinced that benchmarking is a waste of time.
You have to take account of the differences that make a difference, and learn from those who are like you on the intrinsic drivers you cannot change.
Pitfall 6: problems with confidentiality or even legality
Surprisingly often, benchmarking results are presented as a big matrix of numbers, where the rows are the various metrics and the columns are the various observations (albeit not named). You get told you are Column H. In my experience most users of such benchmarking spend the next few hours working out which competitor is Column B, Column C, etc., and are very often right. Not naming the columns has not achieved the desired confidentiality.
- Any data related to pricing have to be historic. No current data or forward projections are allowed.
- The format of presentation must not allow for the identification of individual competitors, even by an intelligent insider. In the USA there must be at least 5 participants in a benchmarking circle.
It is clear that the presentation format described above is not only contrary to the interests of users, by destroying confidentiality, but is actually illegal.
So much for the six pitfalls of bad benchmarking, what are the six pillars of good benchmarking?
Pillar 1: correct each benchmark for key intrinsic differences
This is particularly important when you want the best single-metric benchmark to compare against actual performance, e.g. for a bonus calculation. The way to do this is some form of multivariate statistical analysis, e.g. regression. For any success metric, this finds the best mathematical combination of the various drivers and yields a “par” or expected value. It also gives you an analysis of underlying strengths and weaknesses – how much each driver is driving the par away from the overall mean (if a driver is at its mean, then its impact is zero).
If you have time-series as well as cross-sectional data, there are various “causal modelling” techniques that analyse leads and lags to give an equation with extra weight on factors that are clear lead indicators or causes of success.
Pillar 2: use “look-alikes” to pinpoint improvement areas
This is particularly important when you want to get multiple metrics in a consistent pattern that helps you arrive at a prescription for how to improve. You have a success metric and relevant intrinsic drivers as in pillar 1, but you search the database for observations “like you” on the drivers and learn from the ones performing better.
Pillar 3: join up the analysis with a waterfall framework
A report with lots of disparate numbers comes across as disjointed. Try to find ways of joining up the dots – We have found three ways that make good connections:
- Simple addition or averaging. You can always add up costs or headcounts across departments or cost buckets. You can average cycle times or right-first-time rates across product families. The benchmark for the combined metric should be the combination of the benchmarks for the separate entities. Note that averages should always be weighted appropriately, e.g. by volume.
- Ratio decomposition. By judicious choice you can find very meaningful decompositions, e.g.:
- Cost/ton = (cost/people cost) x (people cost/person) x (persons/batch) x (batches/product) x (products/ton). These are five reasons why your cost/ton may be too high; taking them in reverse order, either you have too much complexity (number of different products per ton produced), too much activity (batches per product in a year), too many people (persons per batch), too high pay rates (people cost/person) or too many non-people costs on top of the people cost (total cost/people cost). If you weight each average by the denominator, the benchmark average of A/B will be the product of the benchmark averages of A/C, C/D, D/E, E/F and F/B.
- Overall equipment effectiveness = availability x performance x quality = (hours operated as % of available) x (actual production per hour as % of rated) x (on-spec as % of production). The three reasons for poor output are not having the equipment available, not running the equipment efficiently, and having too many rejects.
- Indices. There may be many different drivers that measure different aspects of a unified concept, e.g. complexity. The drivers can be combined into a single index additively: Standardise them onto a consistent scale (subtract the mean and divide by the standard deviation) then weight average into a single index using as weights their relative importance in determining performance.
In every case the benchmark for the connected metric is equal to the connection of the benchmarks for the separate metrics, so your deviation from the connected benchmark can be exactly explained by your deviations from the separate benchmarks. For each metric put your actual value and the benchmark in a box. Then display everything in a waterfall of connected boxes. If you denote each positive deviation with a green box and a negative with a red box (neutral with a yellow box), the waterfall lights up with a pattern of “traffic lights” immediately showing where you are good and where you have potential to improve, all interconnected in a logical way.
Pillar 4: quantify the prize to prioritise improvement areas
Having chosen the comparison set (some combination of direct competitors, look-alikes, and par levels), for each element of cost you can calculate the gap in monetary terms. The biggest priorities are the biggest money gaps.
Pillar 5: align benchmarking to wider strategy process
One strategic danger with benchmarking is that everyone converges to a “lowest common denominator” so every competitor is the same, there is no differentiation, and the whole industry becomes unprofitable. In fact, as the figure on the next page shows, the opposite should be true. Benchmarking gives you three main benefits: an understanding of the drivers of performance, options for improvement (usually fairly incremental in nature), and an understanding of what makes you unique. Your strategy process will incorporate other external scanning activities, such as market research, R & D, and social trends. That will interact with your understanding of what makes you unique to give both radical and incremental differentiation options. Successful strategy is a matter of choosing and implementing the right incremental and radical options, informed by your understanding of the drivers of performance and what makes you unique.
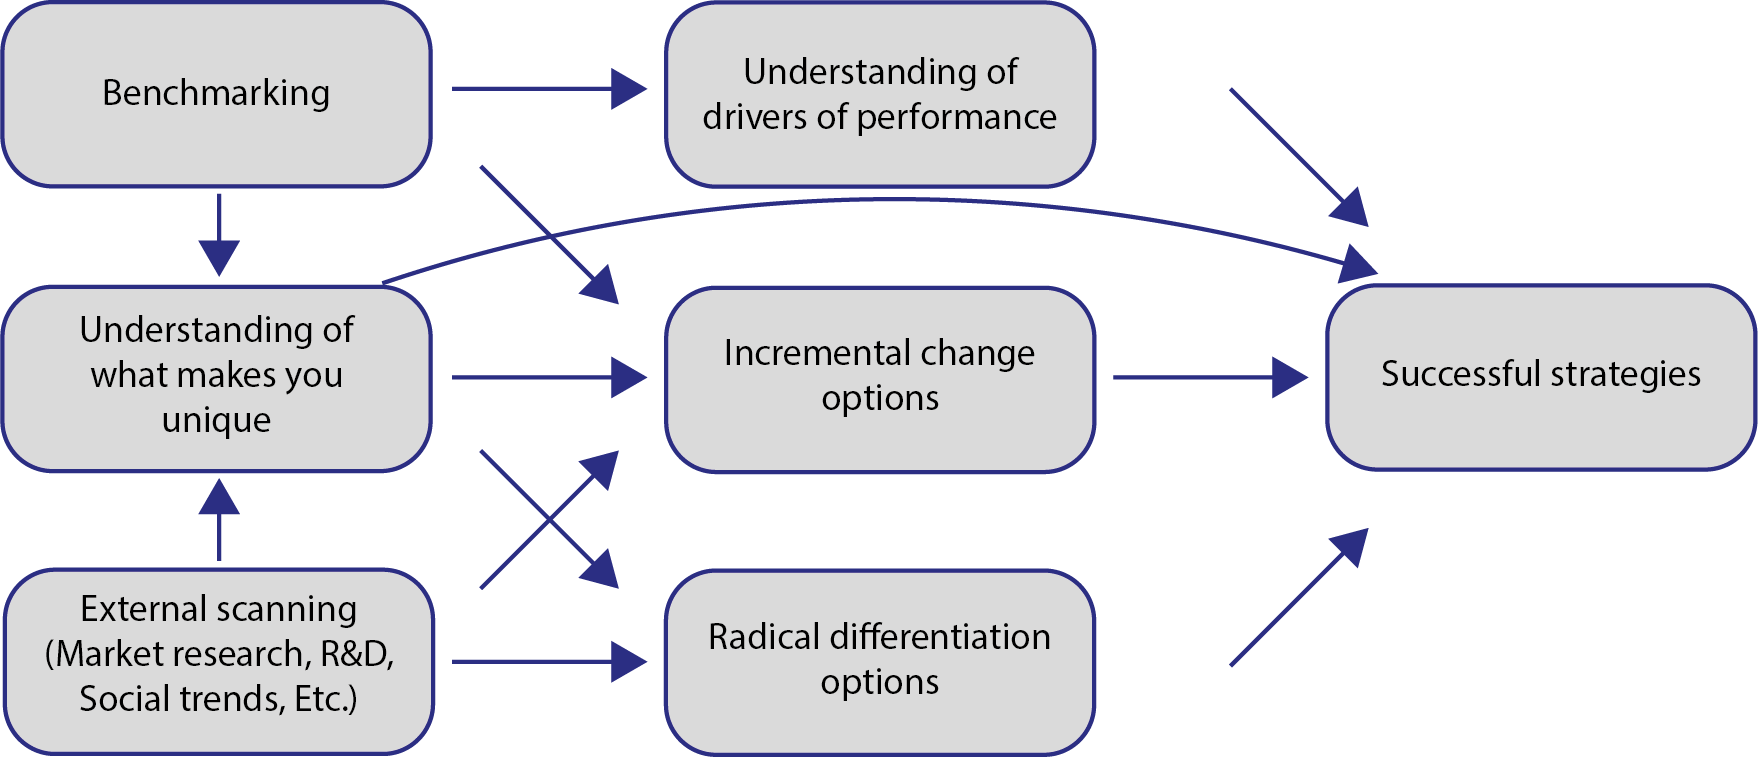
Figure 1: Foundations for successful strategy
Pillar 6: base actions on relevant evidence
There is still a tricky process of moving from analysis to action. Priorities for improvement are not the same as action steps to achieve that improvement. My observation of the most successful benchmarking companies is that they create a task force to:
- Go through the benchmarking report in detail
- Come up with a list of possible action steps that – while they may be implied by the benchmarks – are very concrete in the realities of the particular entity. Not just “reduce headcount in area X by Y”, but “redeploy persons A,B,C and D and reorganise the rest so that each looks after two lines at once and they all help with changeovers”
- Evaluate each action step along two dimensions: impact on performance and likely cost+difficulty. Prioritise first the action steps with a high ratio of impact to cost+difficulty
- Document who will do what by when with what expected result (informed by the benchmarking report)
- Get on with it
- For the more radical high cost+difficulty options, which are not the immediate priorities, revisit the benchmarking database to see if there are any look- alikes to the radical new profile. Are we being over- optimistic or over-cautious? Are there some success factors we haven’t considered? Adjust the plan accordingly.
- For mega-complex options that require overhaul of the entire interconnected system, involving dozens of key people, use the Malik SuperSyntegration® methodology.
In conclusion, we would say that good benchmarking is an essential part of good business management. My experience in many industries is that the companies who benchmark first are generally the good ones, and they are also the ones who are best at assembling the data and using the results. Benchmarking amplifies the effects of both good and bad management, so it is vital to get it right. If you are thinking of hiring someone to do some benchmarking for you, consider whether their pitch focuses on the pitfalls and pillars identified in this article, or whether, for example, it focuses on their knowledge of your industry. In the latter case, remember that if you are present there will be no lack of industry knowledge at the table – but there may be no one with real experience of how to benchmark effectively. We wish you luck!