
Good business management is about transforming limited resources into the best possible results. It requires a blend of strong people skills, deep understanding of customers’ needs and aspirations, process and product knowledge, and a well-organized approach to getting the key things done.
But it’s more than that. All of these virtues are wasted if the business management is targeting the wrong results or misprioritizing the key actions. This article explains an essential first step to targeting the best possible results and correctly prioritizing the key actions.
PIMS (Profit Impact of Market Strategy) started life as a research project in General Electric (GE) in the early 1970s, as a response to the company’s big strategic disaster in the 1960s. GE’s management had done an excellent job of strategic analysis: they foresaw that Information Technology was going to be the key transforming force in human enterprise for the second half of the 20th century and into the 21st. The computer business was growing rapidly, average margins in the industry were very attractive, technology changes were creating opportunities for new entrants, GE as a major customer was well aware of developing market needs, and they knew how to run a technology business.
The situation seemed tailor-made for GE to take on IBM (the “fat and happy incumbent”) and win. Spreadsheets in the 1960s were paper-and-pencil, but they still showed attractive returns. In the event, GE lost around a billion dollars. This was a major shock to a company that prided itself on its scientific approach to business, and caused a major rethink.
In particular, GE decided to research the database of its own diverse business portfolio (from jet engines to television to lighting to polycarbonate plastics to financial services) to see what made a good business to invest in. The findings were startling and still are to many managers even today:
- There is no correlation between ROI today and incremental return on incremental investment: investing in “winners” means you always invest at the peak of the cycle, you never invest in a start-up business, but occasionally you hit the spot. It is exactly as good as investing at random.
- Average industry margins, market size and market growth rate – three widely used determinants of investment – are very weakly correlated with investment success.
- The correct unit of analysis is the strategic business unit (SBU): selling a connected set of products through particular channels to a defined customer set against a defined competitor set. This is the arena in which you should make and implement marketing and investment decisions.
- Investment success is primarily determined by competitive strength and supply chain efficiency, supplemented by some market attractiveness factors. GE had failed in the computer business because it was competitively weak.
- These investment success factors are not only measurable using consistent metrics across different industries, but have identical impacts on performance in different industries. What matters is an SBU’s strategic profile, not what it makes.
- PIMS findings contradict some basic assumptions of economic theory (e.g. that businesses should invest more if their marginal returns exceed the cost of capital). This implies that economics is incapable of explaining many things crucial to public policy, e.g. investment behaviour, job creation, innovation and growth.
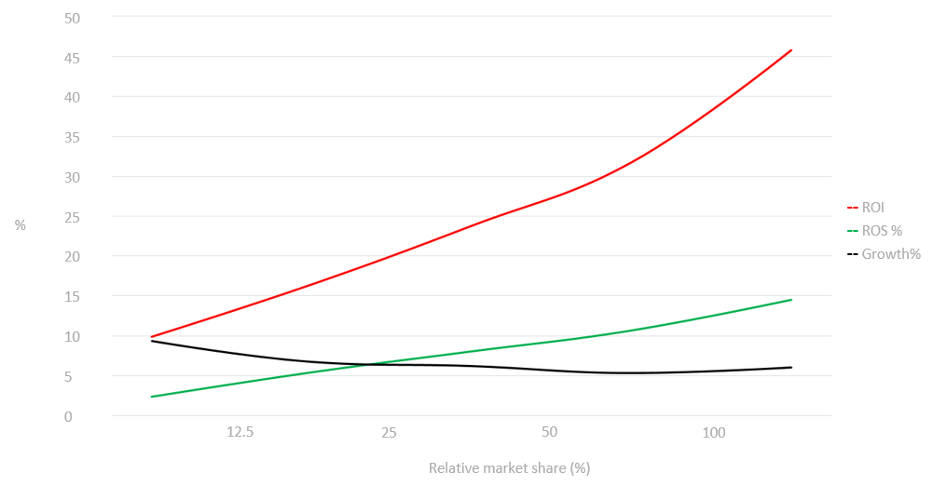
Figure 1: Market share helps profitability but not growth
Relative market share indexes a firm’s or a brand’s market share against those of its 3 leading competitors combined. ROI = Return On Investment = earnings before interest & tax as % of net fixed assets + working capital. ROS = Return On Sales = earnings before interest & tax as % of sales. Growth = % per-annum growth of the business‘s sales revenues at constant prices.
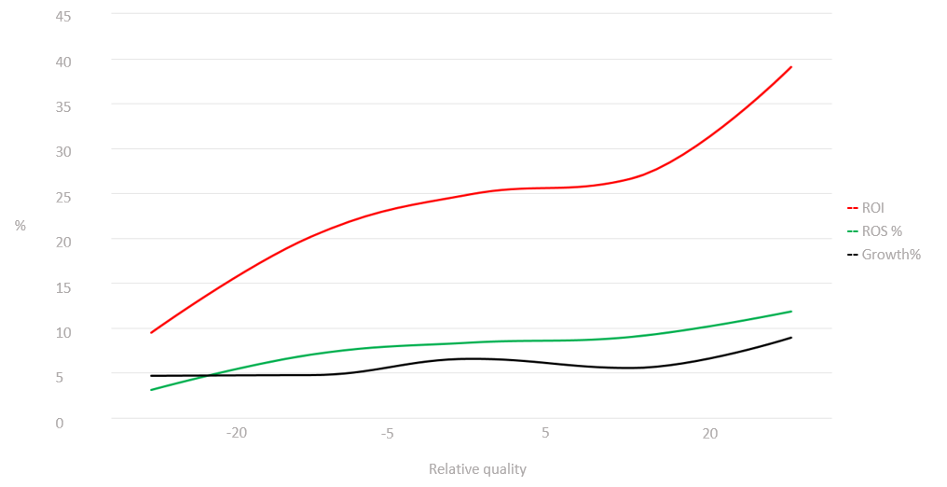
Figure 2: Customer preference helps profitability and growth
What matters is the customer‘s point of view. Product, service, and image attributes are identified and weighted by their importance to customers. – A “win” is when your customer rating on an attribute is superior to that of your competitor. – A “loss” is when your rating is worse. – A “tie” is an equal rating for both. Customer preference = weighted average of (% wins – % losses) across all non-price attributes and all competitors, leaving out % ties. The data points show the average values (ROI, ROS, etc.) for all businesses in the PIMS Strategy database within the defined bands.
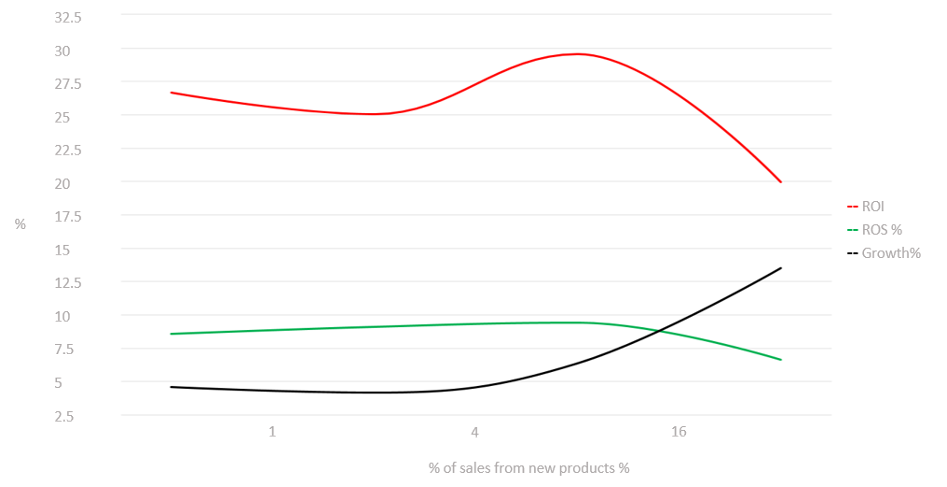
Figure 3: Moderate innovation is best for profitability; high innovation for growth
Innovation rate is the sales revenues generated with new products (up to 3 years old) as a percentage of overall sales. New products are distinct advances from either a customer or a technology perspective. Incremental product improvements, the extension of a product line, or aesthetic changes are not considered to be new products. The data points show the average values (ROI, ROS, etc.) for all businesses in the PIMS Strategy database within the defined bands.
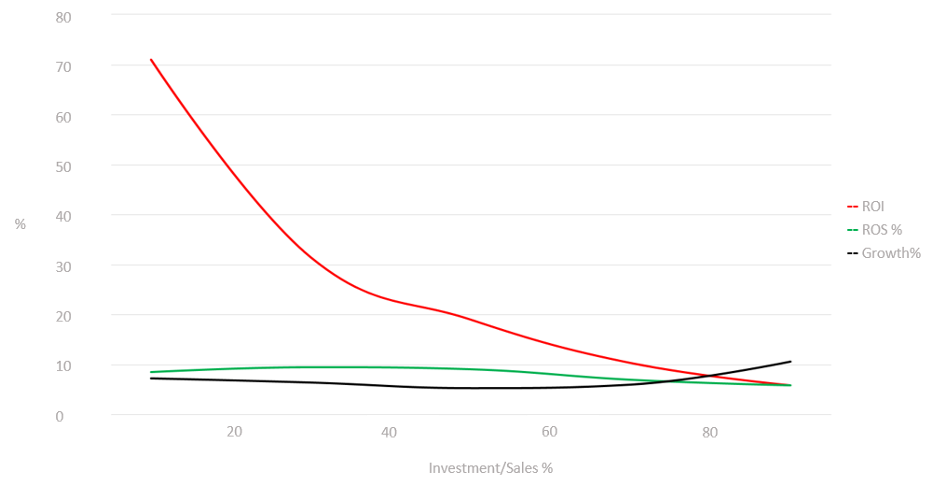
Figure 4: Investment intensity is a very strong driver of ROI
Investment is the sum of working capital, net book value of fixed assets, and any other assets tied in the business. Value added is sales minus products and services purchased (raw materials, etc.). The data points show the average values (ROI, ROS, etc.) for all businesses in the PIMS Strategy database within the defined bands.
GE’s corporate success since the 1960s had many elements, but one of them certainly was the vow never again to invest in a weak competitive position.
Over the last 40+ years PIMS has evolved, via a Harvard-based research program into the drivers of business success, to a non-profit membership organization providing support tools for strategic planners in exchange for SBU data, to being a part of Switzerland’s leading management centre helping managers around the world improve performance by basing decisions on relevant evidence.
What about the people dimension? And can something born 40 years ago be really relevant today?
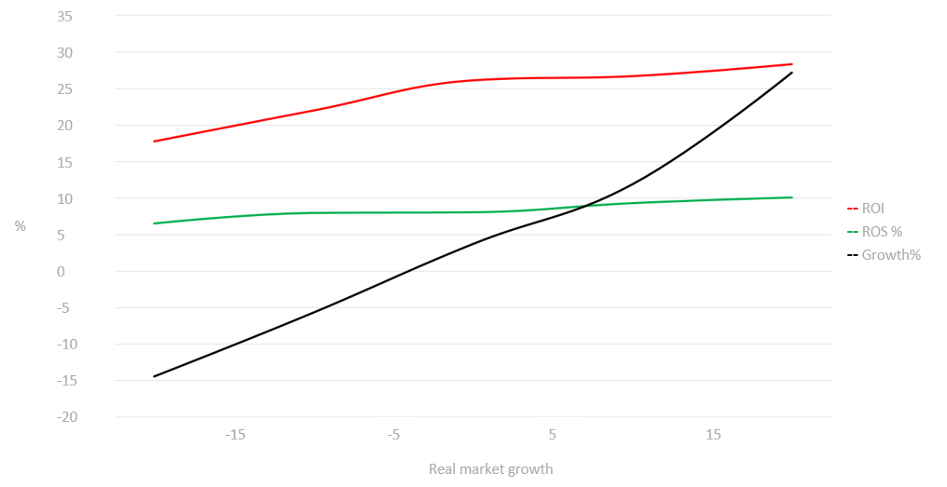
Figure 5: Being in a growth market helps profitability
Real market growth is the growth rate of market served at constant prices. The data points show the average values (ROI, ROS, etc.) for all businesses in the PIMS Strategy database within the defined bands.
Taking the last question first: we add around 200 new SBUs each year to the PIMS database, the data coming from live consulting studies. Obviously some metrics do change over time, particularly on the “supply chain efficiency” side. Turnover rates for both fixed and working capital do continuously improve, mainly due to better ERP systems. Labour productivity gets better as technology and management practices improve. Business overheads are continually squeezed. Interest rates and inflation have recently been lower than the 40-year average. Generally, though, these benefits have been competed away in most markets: inflation-corrected results have improved slightly, non-inflation-corrected results have deteriorated slightly.
Most importantly, though, the non-financial drivers have not only remained directionally the same, but even quantitatively the same. On average, the profit benefit of 5 points of market share or customer preference was the same in the 1980s, the 1990s, the 2000s and the 2010s.
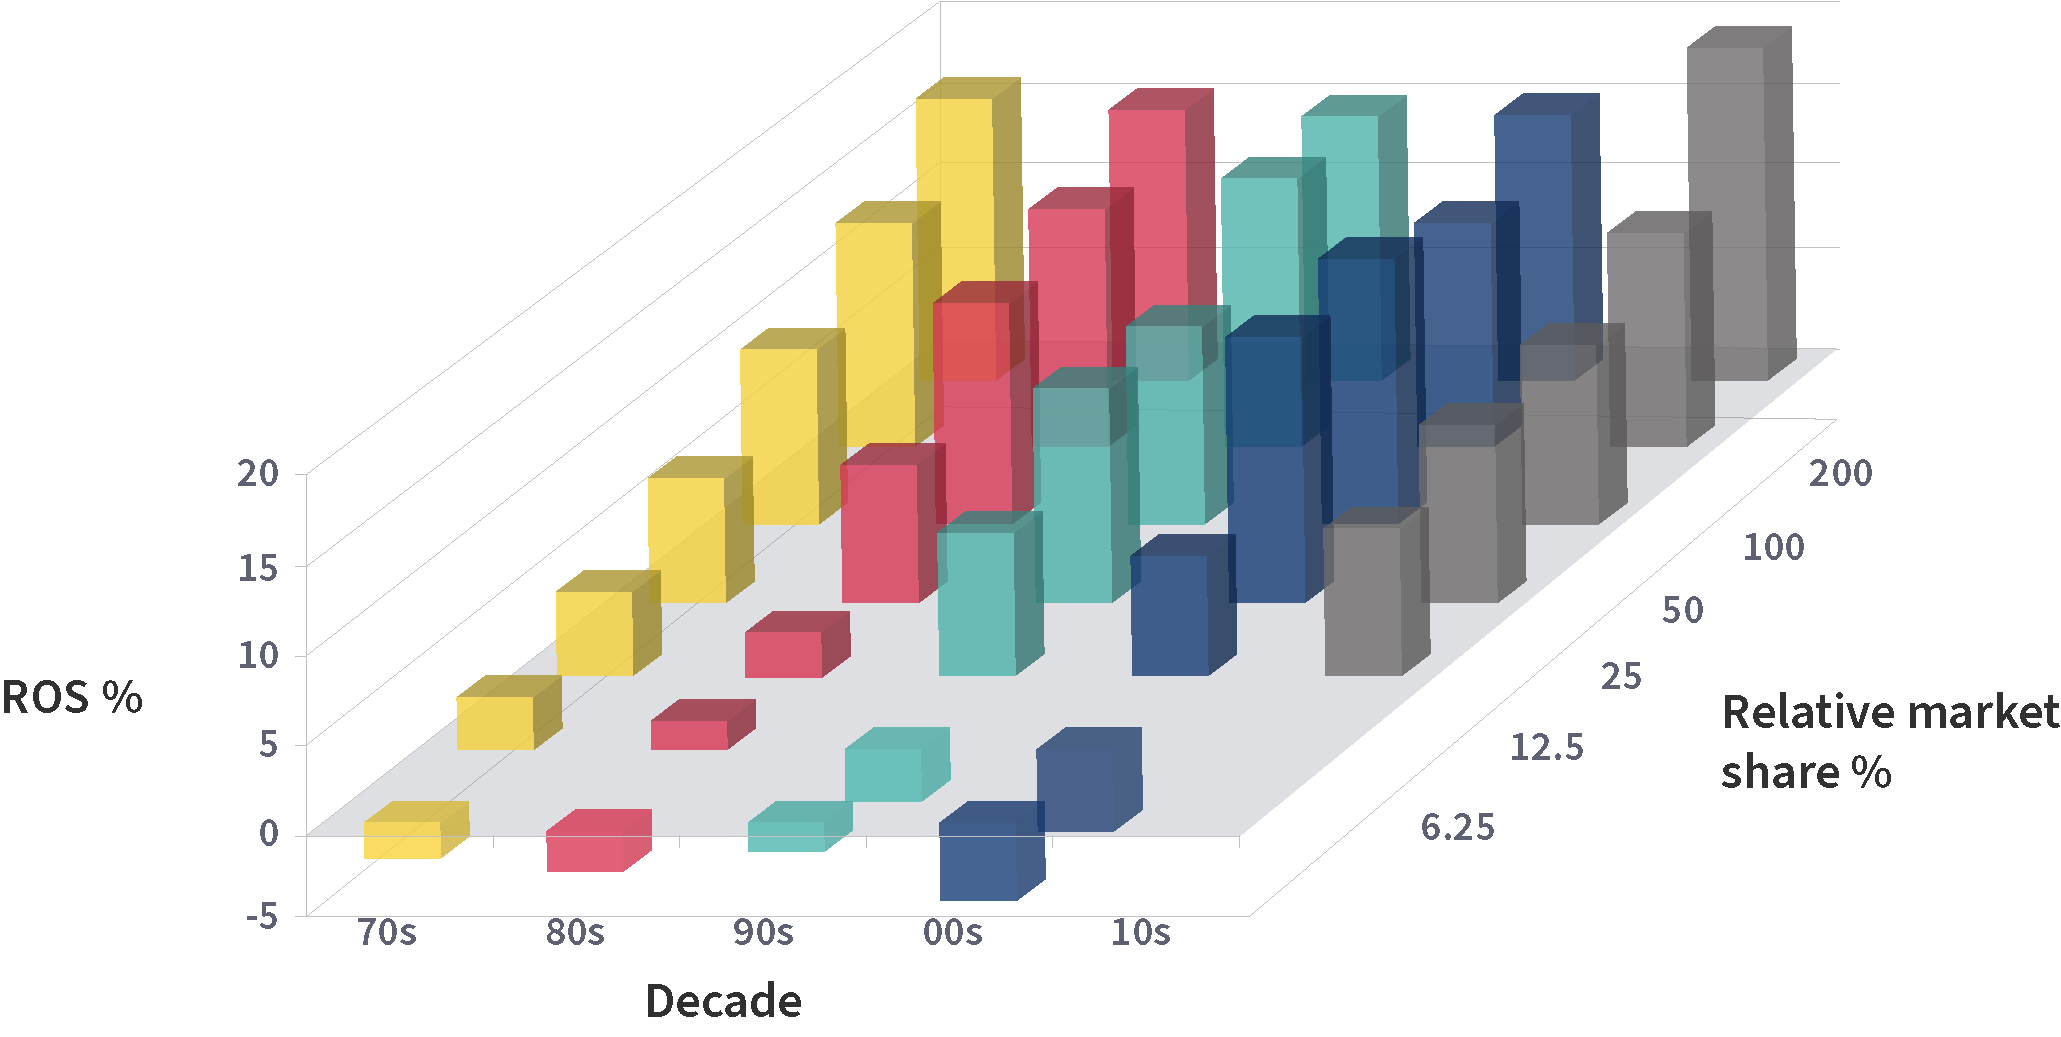
Figure 7: Shows the result for ROS vs Market share
We are most interested in effects that remain constant over time. We can safely assume then that these effects will continue to be stable. The chart shows – for ROS versus relative share – that differences across decades (front to back) are quite small while the effects of relative market share (left to right) are fairly constant. This is true for all PIMS key drivers. The data points show the average values (ROI, ROS, etc.) for all businesses in the PIMS Strategy database within the defined bands.
This is a major additional PIMS finding, and a particularly reassuring one: since the benchmarks are time-independent, we can be more confident they will apply into the future. Indeed, an effect that was time-dependent would be completely useless for planning purposes. This point was continually questioned during the “dot.com bubble”: however, the popping of that bubble perhaps increased everyone’s faith in the constancy of the laws of business success.
What about the people dimension? The last 30 years has seen a huge volume of research into how culture, incentives and organization drive success. While much of this has verged on the trite (“people in successful companies are happy, people in unsuccessful companies are unhappy, therefore the way to be successful is to make your people happy”), there is clearly a real effect too – and whatever the direction of causation, employee satisfaction belongs on a “balanced scorecard” of success. Fortunately the PIMS framework allows us easily to append “people excellence” metrics to the database, and to quantify their effects. It turns out that “people excellence” is related both to achieving a good strategic profile and to converting that into good performance. Culture and incentives need to be aligned to business strategy: for growth you need openness, flexibility and long-term incentives, for retrenchment you need clarity, firmness and short-term incentives.
What about other approaches? The commonest approach to business strategy is “wishful thinking” (as opposed to PIMS “evidence-based thinking”). The idea seems to be that if you wish for something hard enough and long enough, it will happen. Other names are “strategic vision”, “stretch targets”, etc. While this works all the time in the movies, the only evidence for it in real life is that most successful people did indeed want to succeed. Unfortunately, a lot of failures wanted to succeed, too.
The next commonest approach to business strategy is “shooting from the hip”. Try something – if it works, do it more, if it doesn’t, try something else. However, the fact is, most managers really only have the chance of 3 or 4 failures before they get fired: wouldn’t it be worthwhile to pre-test the options against relevant experience so that you choose the ones with the best chances of success?
A third common strategy is “copy the leader”. Identify the most successful company in your industry, establish their winning formula, and aim to match them on their key success factors. The military equivalent to this would be: if you have a weak army, identify the strongest possible enemy, establish the terrain on which they are strongest, and attack them on that. History suggests that is a good recipe for suicide. Similarly for trying to compete against, say, Wal-Mart by trying to be better than them on the things they are good at. It makes much more sense to avoid attacking them on their strengths and to be good where they are weak: the relevant exemplars may be other David’s attacking Goliaths successfully in other arenas – what PIMS calls “strategic look-alikes”. Wal-Mart makes the mistake itself when it applies benchmarks from its market-leading core US business to its overseas subsidiaries (which are not market leaders) and then wonders why they don’t perform.
A fourth common misguided strategy is “cost leadership”. Cut all the frills, locate activities in the lowest possible cost environment (labour, energy, materials, logistics, whatever), pick up second-hand capital equipment, and watch sales take off as your competitors can’t match your prices. Unfortunately, your competitors can and will match your prices for a few years, and nobody will make any money. This is particularly true in capital-intensive industries where barriers to exit are high and every marginal piece of business above variable cost appears to make a cash contribution.
The book “In Search Of Excellence” took the approach of looking across industries for successful companies with common features, and then ascribing their success to these features. The result was a mixture of:
- reverse causality traps (“happy employees” again)
- factors shared by all companies, successful or unsuccessful (“quick decisions”)
- the wrong level of aggregation (companies not SBUs)
- valid factors (“passion for the customer”).
Not surprisingly, many of the “excellent” companies looked quite the opposite a few years later.
“Shareholder value” as a strategy started off with the sensible aim of trying to get the school solution on the right relative weights of growth versus profitability in the company objectives. Unfortunately it then got hijacked by backward-looking financial analysts saying “invest” or “disinvest” on the basis of projected returns versus cost of capital, saying “borrow, borrow, borrow” on the basis of balance sheet efficiency, and saying “demerge” on the basis of stock market sector premiums. A lot of the sums were done on a “wishful thinking” basis and many decent companies (e.g. Marconi) were destroyed.
I apologize if I haven’t covered every possible alternative to using PIMS for these key tasks. Presumably there are business geniuses out there who will do it right anyway. But since there is a proven way for non-geniuses to improve the chances of success, that requires less than a man-month of effort to apply to a strategic business unit, it must surely be worth every company doing.
The process for using PIMS starts with business unit definition and data collection (typically a week for a company with <10 related business units and data held centrally). PIMS uses three main tools to identify performance potential and identify what needs to change.
Applying these tools to a portfolio of businesses takes 2 – 3 days unless the company really has no idea of customer perceptions for the CVA, in which case some external research is required.
The result is a prioritized list of what needs to be changed, where resources can be most productively invested (or released), and quantified performance expectations under a range of economic scenarios.
| PAR ROI model | Report on look-alikes (ROLA) | Customer Value Analysis (CVA) |
|---|---|---|
| Par measures business potential and identifies strategic transformation or just operational improvement. | The ROLA allows you to learn from strategic peers, businesses in a similar position as you are in now. What improvements are key to realising your full potential. | CVA leads to correct segmentation and enables you to create clear water ahead of competitors. How much do target customers value key attributes and are you hitting the right price points? |
The PIMS evidence and analysis form an ideal first step for a rapid integrated business improvement programme using the Malik SuperSyntegration. This harnesses the collective intelligence of the whole organization, with the Malik framework for better business functioning, to create and implement action programmes for markedly improved – and sustainable – business results.
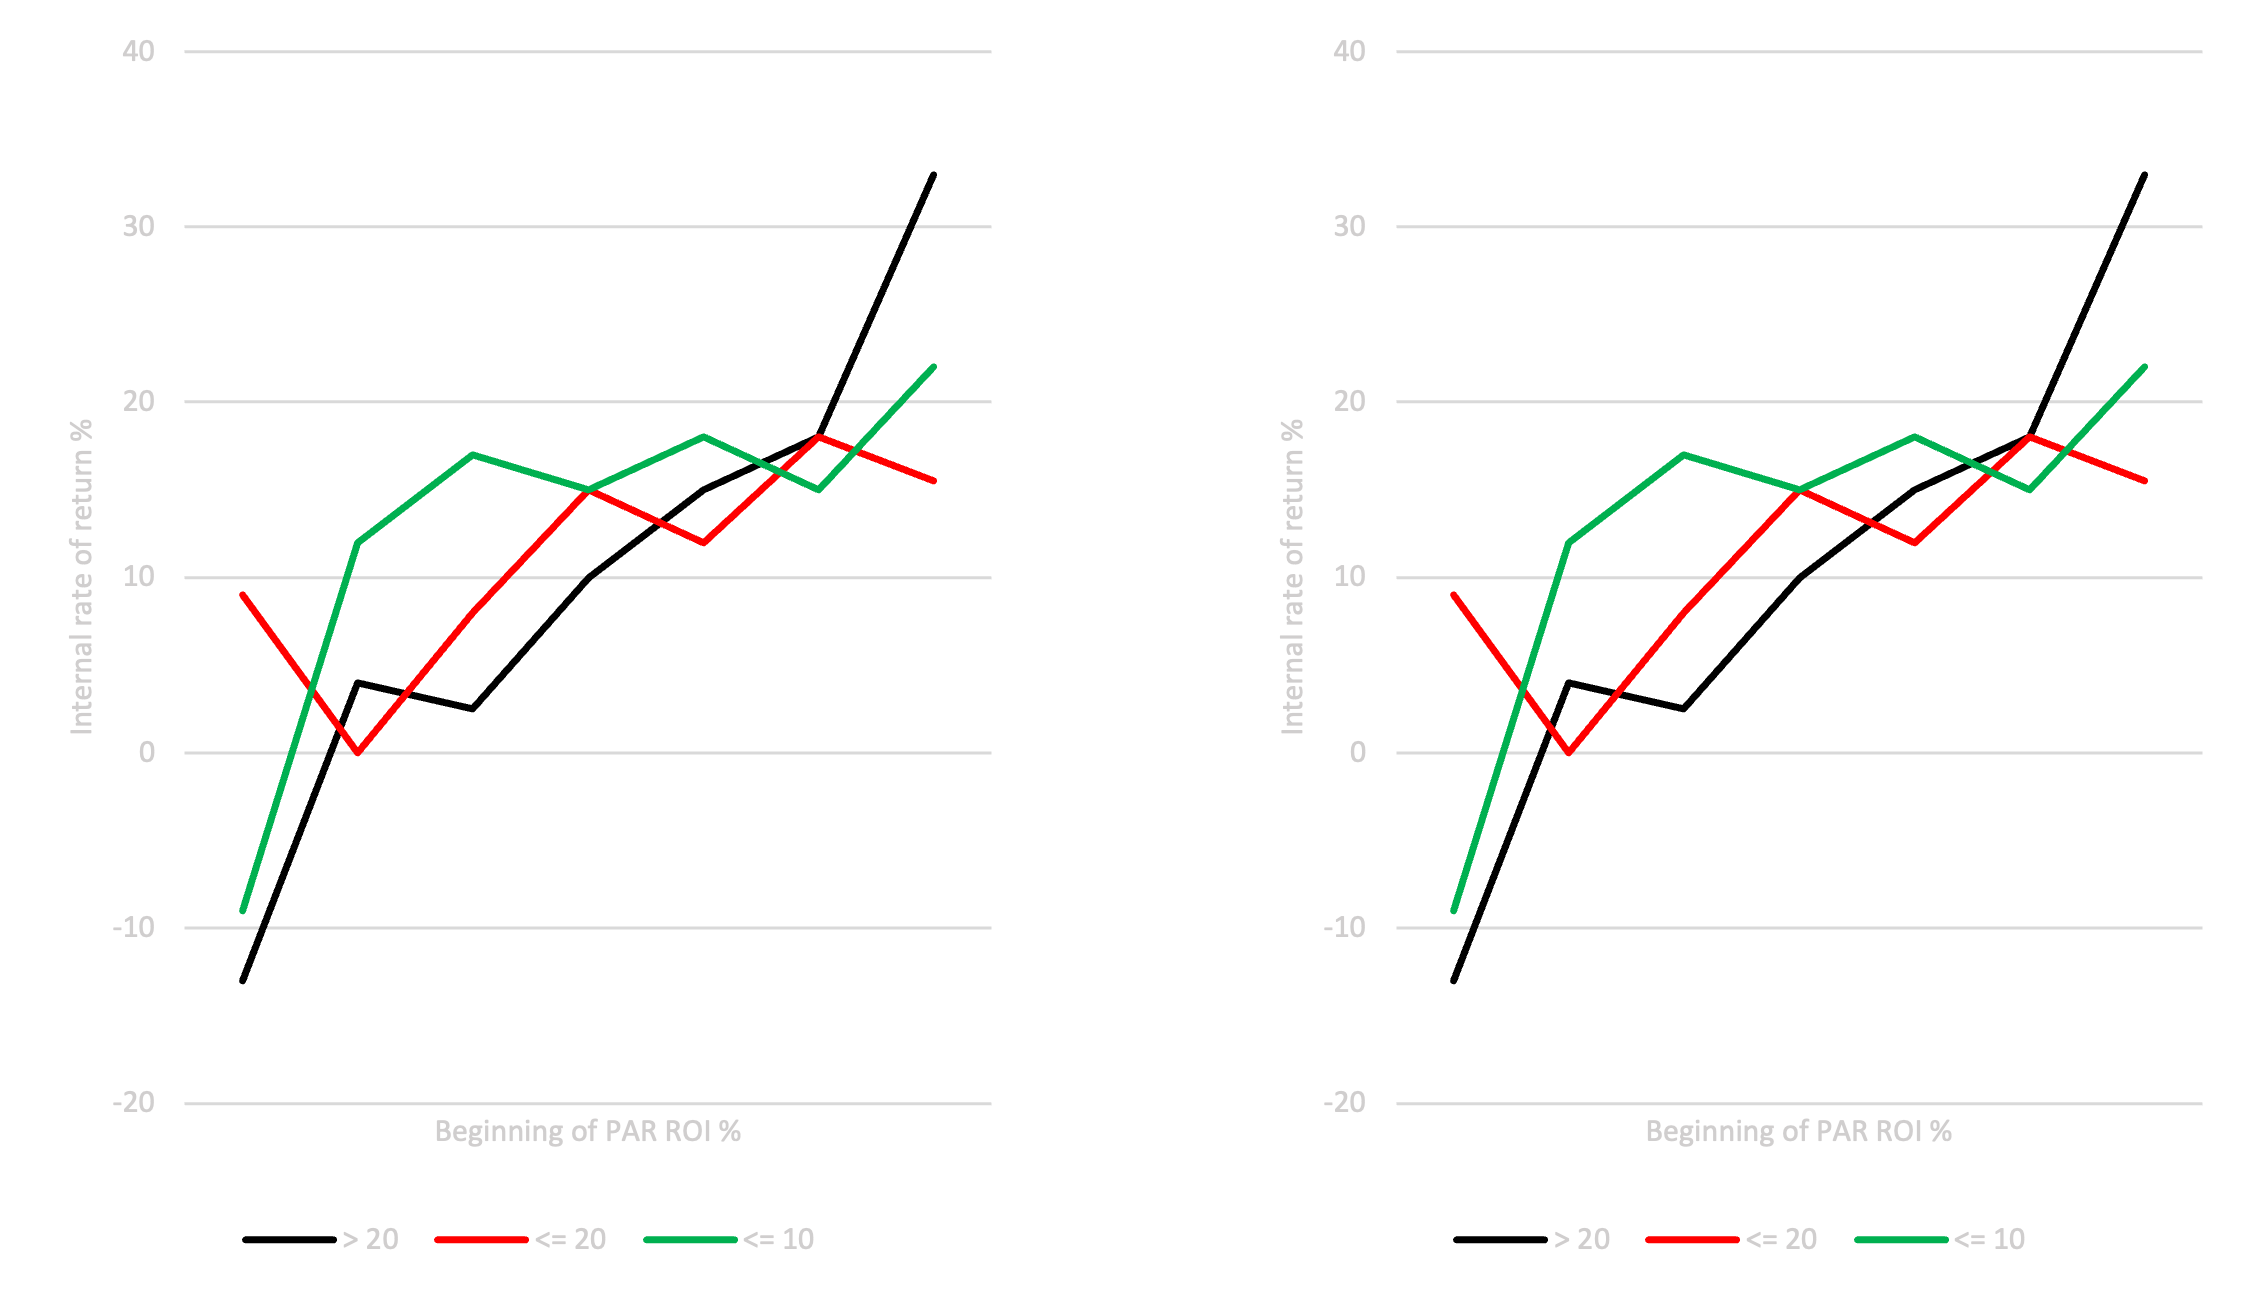
Figure 8: Par ROI, not actual ROI, tells you where to invest
IRR measures the shareholder‘s growth in wealth from buying the business in year 1, running it for 4 years and getting its free cash flow, and selling it in year 4. For all rates of investment growth, the slope for wealth creation vs beginning par is much steeper than the slope for wealth creation vs beginning actual. Source: PIMS database. The data points show the average values (ROI, ROS, etc.) for all businesses in the PIMS Strategy database within the defined bands.


I wanted to thank you for this great read!!
I certainly loved every bit of it. I’ve got you book-marked to check out new things you